
Sick of one or two metrics skewing all your reporting data?
From the feedback we’ve had, there is a large portion of you who do—and internally we find it annoying too.
In the past, we had a one size fits all solution, where we used an “Average” calculation for all our reporting metrics.
While this works great for most teams, if you have one or two conversations that have high (or low) response times or replies, this could completely skew your overall metrics.
So to give you and your team a bit more flexibility, we’ve just launched a new setting that allows you to choose how your reporting metrics are calculated as either Average, Median or Percentile.
Here is a little about how each works below…
Average (mean)
Previously, the Average(in maths terms, called the mean) was used, which simply adds up all the numbers and divides it by how many numbers were in the dataset. This works great for datasets where all numbers are similar, but if it contains one or more outliers (i.e. numbers that are extremely high or extremely low compared to the rest) it will drive the average either upward (with high outliers) or downward (with low outliers).
This metric is recommended for teams with a consistent flow of incoming conversations, and you want the average of all conversations.
Median
The Median fixes this by sorting the numbers by size and taking the value that is in the middle. That way, an outlier won’t skew the average number, and you’ll have a better view of what the metric is for the majority of cases.
This is recommended for teams which might have some conversations that are outliers from the norm, and where you don’t want those conversations to skew the metrics.
Percentile
Lastly, the Percentile works similar to the median, except that you can get the number at any point in the dataset except just from the middle. For example, this allows you to set it at 80 to see what the metrics are like for 80% of your customers.
Recommended for teams where you want to see what the metrics look like for a certain percentage of your customers
Where do I make the change?
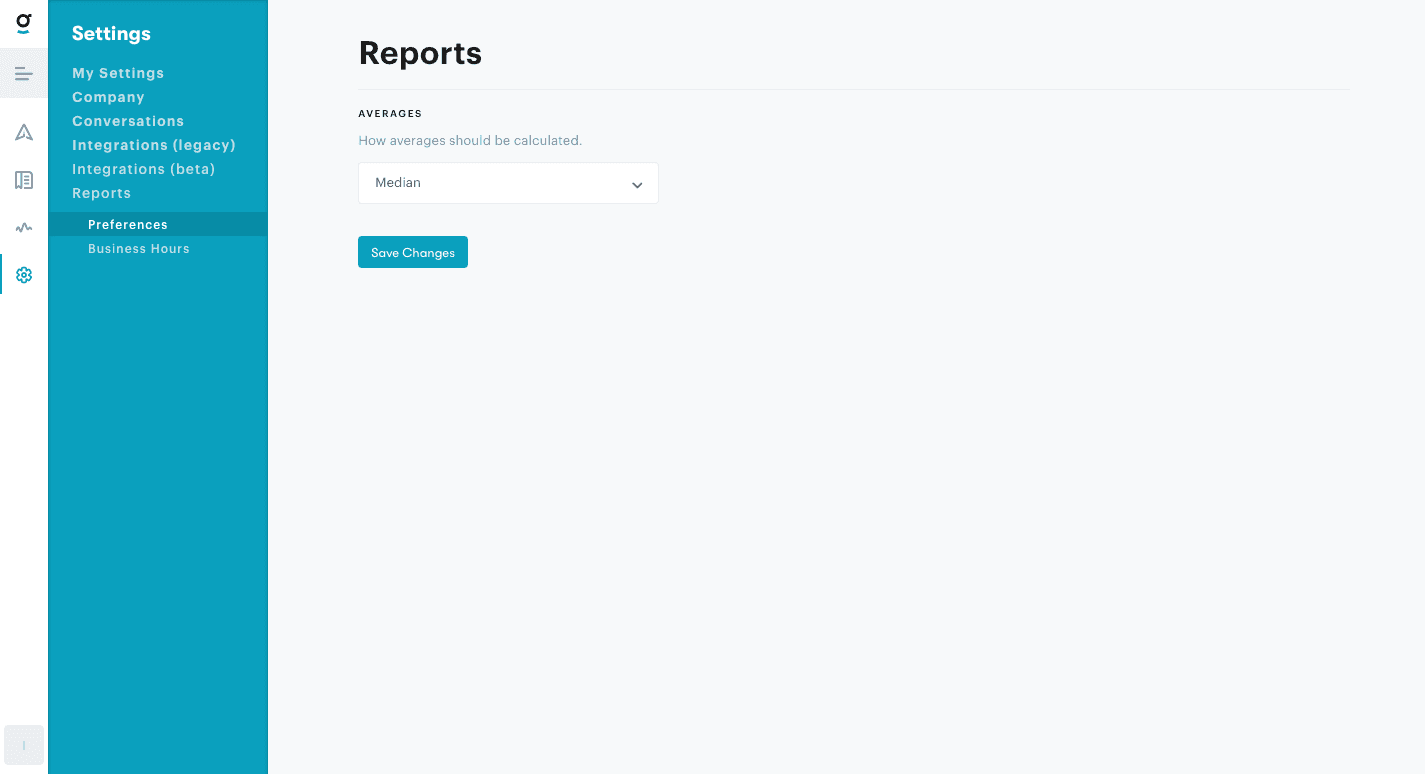
It’s a company-level setting to ensure everyone is looking at the same data, and it can be customized under Settings > Reports > Preferences. New accounts will use median by default, but to keep things familiar for old customers they’ll be kept on Average (mean).
Groove Partners with Import2 for Seamless Help Desk Data Import!
We are thrilled to share some fantastic news with you! Groove has joined forces with Import2 to bring you a seamless and efficient solution for importing data from other help desks. Our partnership with Import2 opens up new possibilities, making it easier than ever to transition your data into Groove. Whether you’re migrating from another […]
Groove 2023 in Review – A Year of Supercharged Support
2023 was a year of exponential growth and innovation for Groove! We poured our hearts (and countless cups of coffee) into crafting new features and optimizations to make your customer support experience smoother, faster, and more delightful than ever. Here’s an overview of the biggest and best changes that transformed Groove this past year. New […]
