
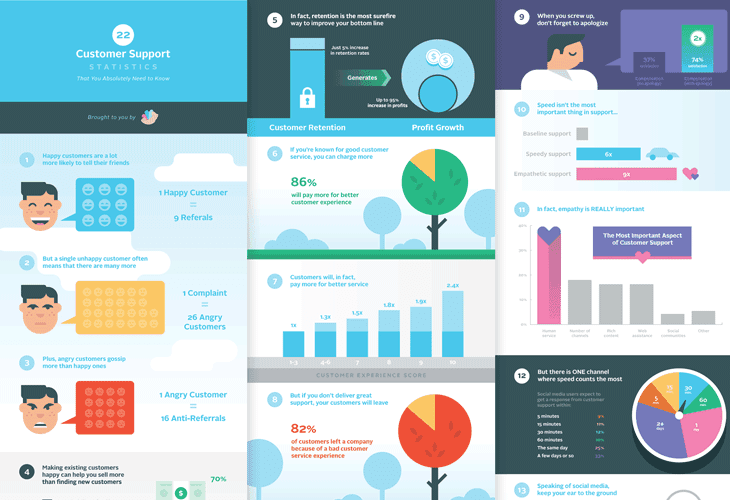
Infographic: 22 Customer Support Statistics That You Need To Know

The key numbers that should drive your customer service strategy.
There’s always the “standard” customer service advice that seems to get repeated all over the web without any real proof or meaning.
“Be human!”
“You must be on Facebook!”
“Speed is number one!”
And then there’s the truth.
Researched and proven findings that, although sometimes unconventional, can hold the keys to better results.
Since we first published our list of customer service statistics two years ago, there’s been a lot of interesting new data that has revealed how the customer support landscape is changing, and what you can do about it.
Check out this infographic we’ve put together highlighting some of the most important findings.
And if you enjoy it, please share! You can grab a snippet at the bottom of this post to embed the infographic on your own blog.
Click on the preview below to see the full version.
Want to share this infographic on your site or blog?
5 Help Scout Alternatives: Why Growing Support Teams Switch to Groove
Groove Fixes What Teams Don't Like About Help Scout: Flat Pricing, Built-In AI, and Native SLA Management. See the Full Comparison.
How Helply's Hallucination-Proof AI Eliminates the #1 Fear of AI Customer Support
Customer Support Automation That Hits 65% AI Resolution, Guaranteed. Helply's Action-Based AI, Safe Escalations, and Optimization.
