
How To Use Data To Improve the Customer Experience: A Guide For Small Businesses

Common CX challenges often have a root cause that you can uncover with the right information. But many startups struggle to understand how to use data to improve customer experience in productive ways – or even where to look.
Is your business struggling to understand why customers keep abandoning their shopping carts before completing purchases?
Or maybe you’re befuddled by the low adoption rate of a promising new feature?
In this guide, we’ll explore how to use data to improve the customer experience. From setting up analytics tools to personalizing interactions, you’ll learn how to resolve issues proactively and boost customer satisfaction. Let’s jump right in!
What Data Can Tell You About the Customer Experience
Data reveals insights that help you tailor services and products to better meet customer needs. While numbers can’t tell you everything, they can identify patterns and trends that highlight what your customers value. They also illuminate points of friction, and point you towards solutions.
What should you track? Some of the key metrics for measuring and improving the customer experience include:
- Customer Satisfaction Score (CSAT). Helps to gauge overall satisfaction with a product or service. It provides direct feedback from customers about their experiences.
- Net Promoter Score (NPS). Measures customer loyalty, and the likelihood that they’ll recommend your business to others. This is useful for identifying potential brand advocates.
- Customer Effort Score (CES). How easy it is for customers to get their issues resolved. It highlights areas that might require simplification or better workflows.
- First Response Time. Measures how quickly customers receive initial responses to their inquiries. Fast response times demonstrate efficiency and attentiveness.
- Resolution Time. Tracks the time it takes to fully resolve customer issues. Efficient resolution times indicate streamlined support processes.
- Knowledge Base Engagement. Shows how frequently customers use your knowledge base resources. High self-service engagement indicates a valuable resource that cuts down on tickets.
- Customer Churn Rate. Represents the percentage of customers who stop using your product or service. Churn rate analysis can identify issues that may be causing customers to leave.
- Customer Retention Rate. Tracks the percentage of customers who continue to do business with you over a period of time. A high retention rate indicates strong customer loyalty and satisfaction.
- Customer Lifetime Value (CLV). This is the total revenue a customer will generate during their “lifetime” relationship with your business. Understanding CLV helps prioritize customer segments and tailor marketing efforts
Each of these metrics plays a vital role. By keeping tabs on them, you can make data-driven decisions to improve customer satisfaction and loyalty.
How To Use Data To Improve the Customer Experience with Groove (In 4 Steps)
The above list might seem like a lot to worry about! Fortunately, most (or even all) of the necessary metrics can be automatically tracked, and compiled in a way that’s easy for an analytics newcomer to understand.
What follows is our advice for how to use data to improve the customer experience. By following these four steps, you can streamline customer interactions with your business.
Step 1: Set Up Groove To Gather the Data You’ll Need
To start, you’ll need the right tools in place. Unless your customers number in the dozens, trying to keep tabs on everything manually isn’t feasible. You need a dedicated tool to gather data directly and indirectly from your customers.
Groove – our customer support helpdesk for small businesses – lets you do that easily. It’s much simpler to use than a traditional analytics platform, and focuses on just the metrics you need for improving CX. Plus, it helps you collect data directly from customers through survey integration and dashboard reporting.
Most importantly, with data collection and reporting built right into your customer service dashboard, you avoid the hassle of relying on third-party solutions. And of course, it can do a lot more than just reporting – Groove is designed to save you time and effort while facilitating top-quality support.
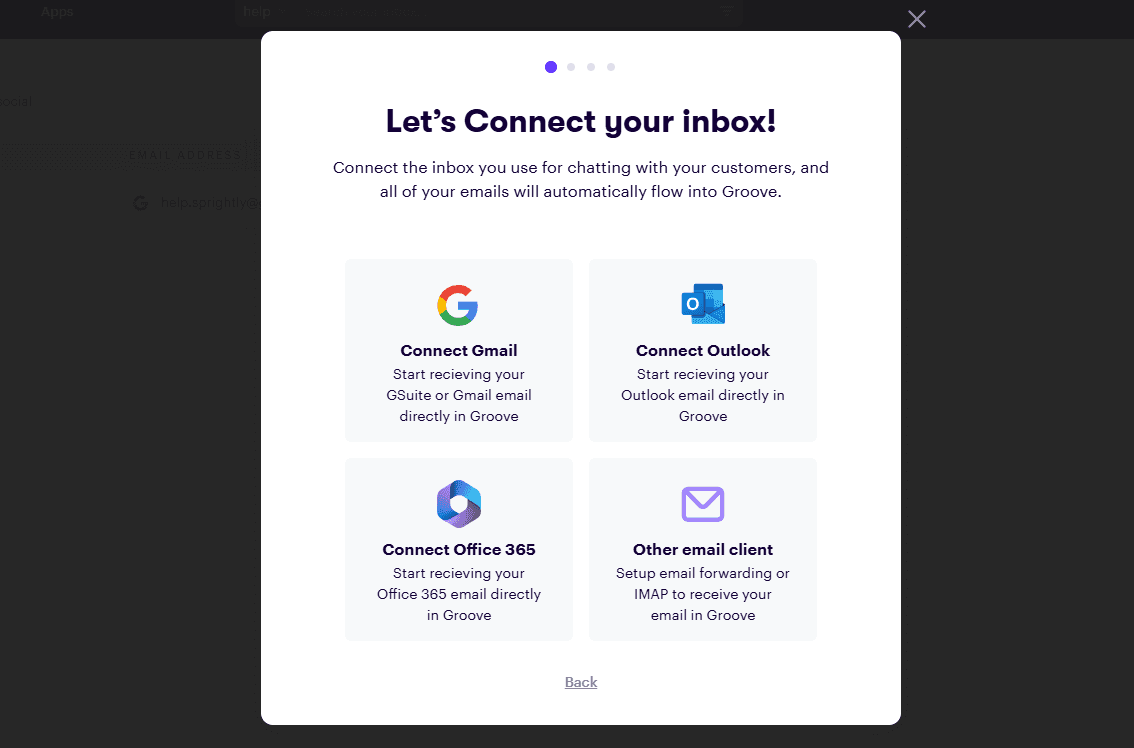
If you’re new to Groove, setting it up is straightforward. Once you’ve signed up and connected your inbox to your various customer service channels, it’s ready to serve as the foundation for your data-driven strategies.
Step 2: Set Up Analytics and Instant Insights
After setting up your account, the customer data will start flowing in. To see where it will be collected, select the Reports tab in your dashboard, and you’ll get access to two forms of reporting:
- Inbox. Focused on customer interaction. Here you can track ticket resolutions, opened vs. closed tickets, agent productivity, resolution time, and customer satisfaction.
- Knowledge Base. Collects information from your self-service knowledge base (which you can create via Groove as well). See your most viewed articles, frequently searched terms, and median time spent reading your content.
Inbox Reporting
Inside the Inbox menu, you’ll unlock a number of insights by simply setting up your Groove inbox and responding to tickets. This will automatically begin to capture key metrics.
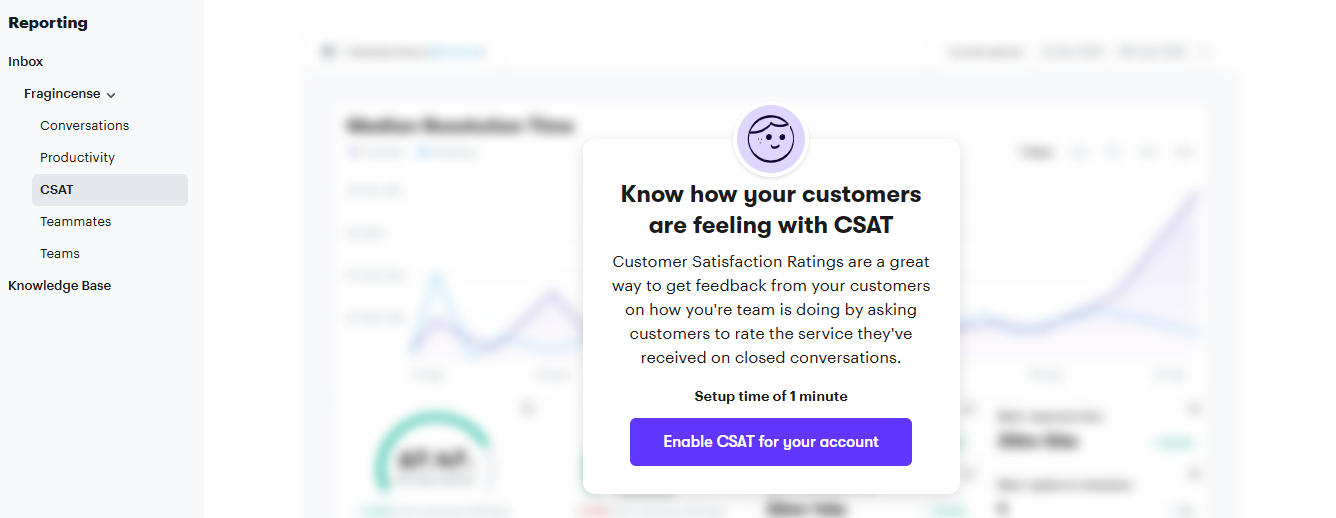
The only manual setup required is located in the CSAT section. This is where you can track your customer satisfaction score. Knowing if your customers are happy with your service is a vital baseline.
In this section, you can enable CSAT for your account:
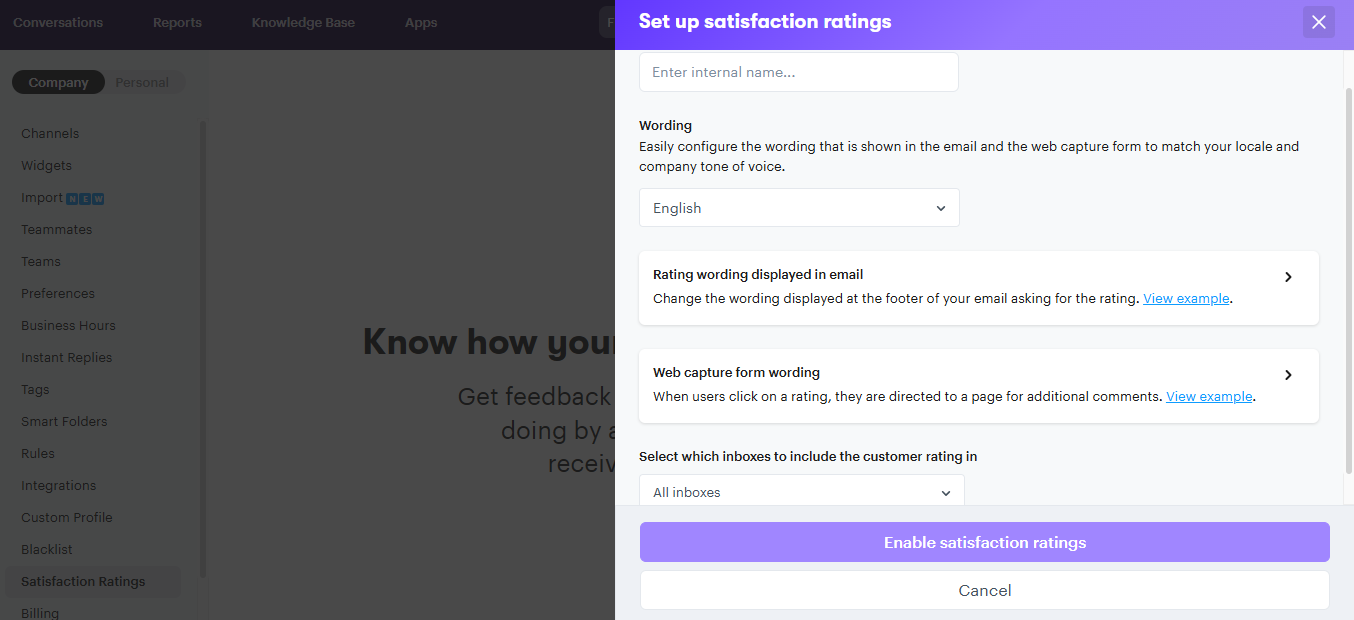
You’ll then need to configure how you want the ratings to appear to customers, and where you want them to show up:
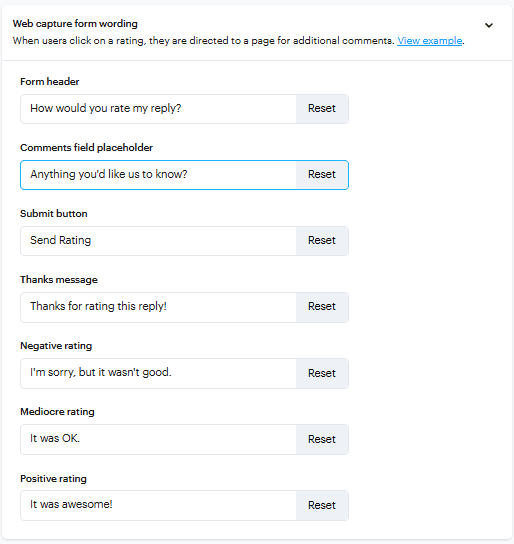
You can also set up the form’s options and wording, so they align with your brand’s tone of voice:
Knowledge Base Reporting
In order to access insights from Knowledge Base reporting, you’ll first need to publish some articles. Setting up a knowledge base is a great way to help customers help themselves, and save your team valuable time. Customer self-service is one of the easiest methods for cutting down on ticket volume.
So make sure that the content is informative and relevant to your customers’ needs. Once you have a handful of articles under your belt, you can use collected insights to keep expanding the available resources. For example, if your most popular article is about how to install a particular widget, you might publish additional content on how to use that widget optimally.
Groove also enables insights through ratings:
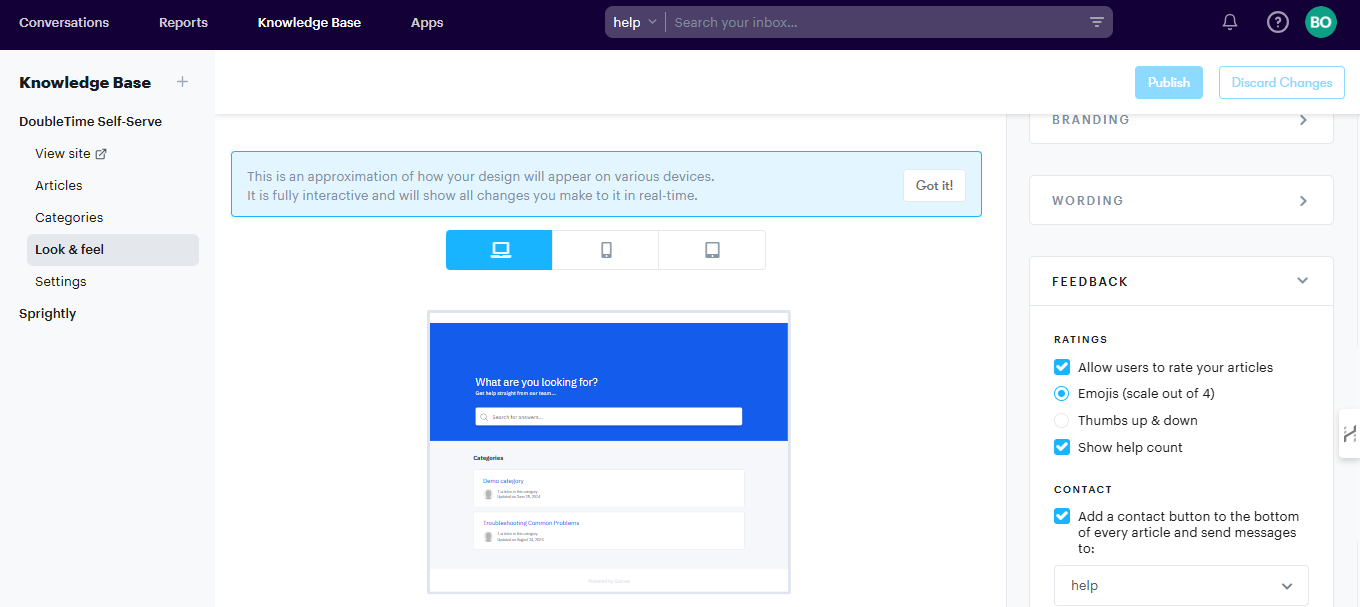
In the Knowledge Base section of your Groove dashboard, click on Look & Feel and select Feedback. Under Ratings, you’re presented with options to:
- Allow customers to leave ratings on articles
- Choose emojis that customers can use to express their feelings
- Display the number of people who have found the article helpful
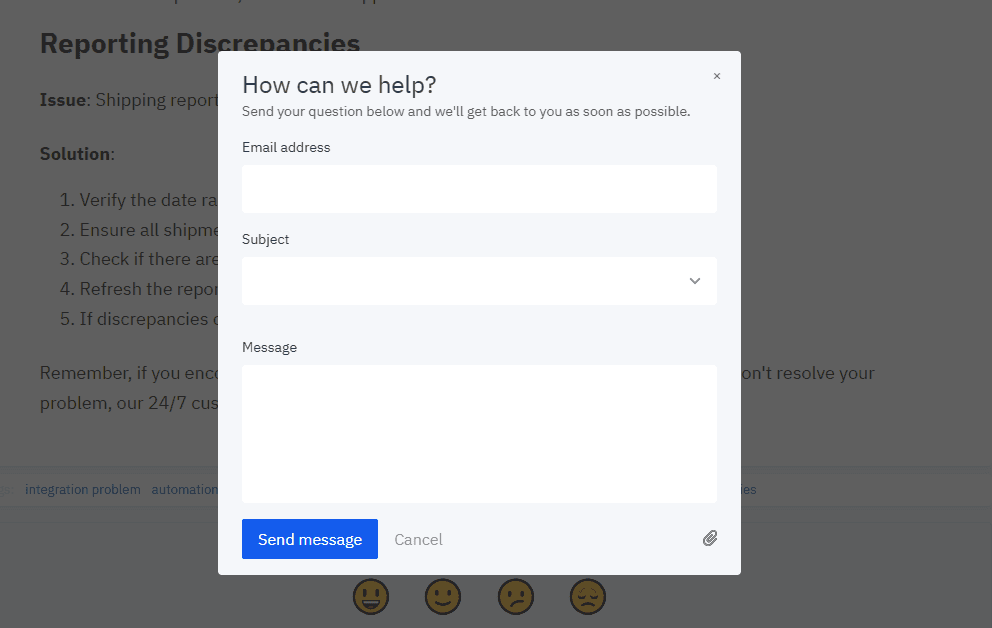
- Leave a link to contact you directly if customers haven’t found the article helpful

That last option is especially important. By checking the Contact box, you’ll enable customers to send emails after reading articles if they didn’t find the information they needed. You can select the inbox you’d like the emails routed to in your Groove account:
That’s all you need to know to gather knowledge base insights via Groove!
Step 3: Analyze Customer Data
After you’ve set up Groove’s inbox and reporting features, you’ll need to give the data some time to collect. When you’re ready, the next step is to start reviewing and using the information. Let’s take a closer look at what data is available and what it all means.
The Conversation Report
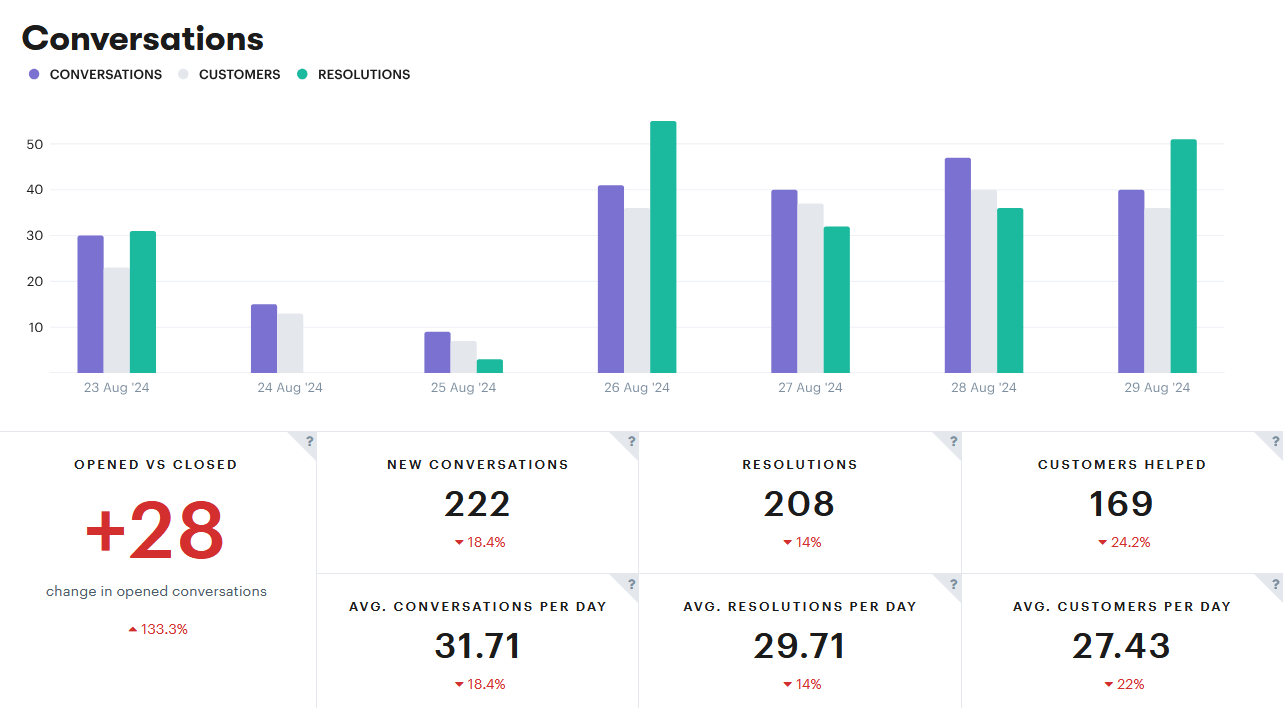
For each of your active inboxes, you’ll find reports under the Conversations tab. These provide insight on:
- How many conversations take place between your agents and customers
- How many customers are helped by your agents
- The average number of issues your team resolves for customers
- The number of new conversations coming into your inbox (versus ticket responses)
- The number of tickets closed within a certain time period
- The busiest time of day when customers reach out
- How often a specific email tag is used
- The individual performance of each team member
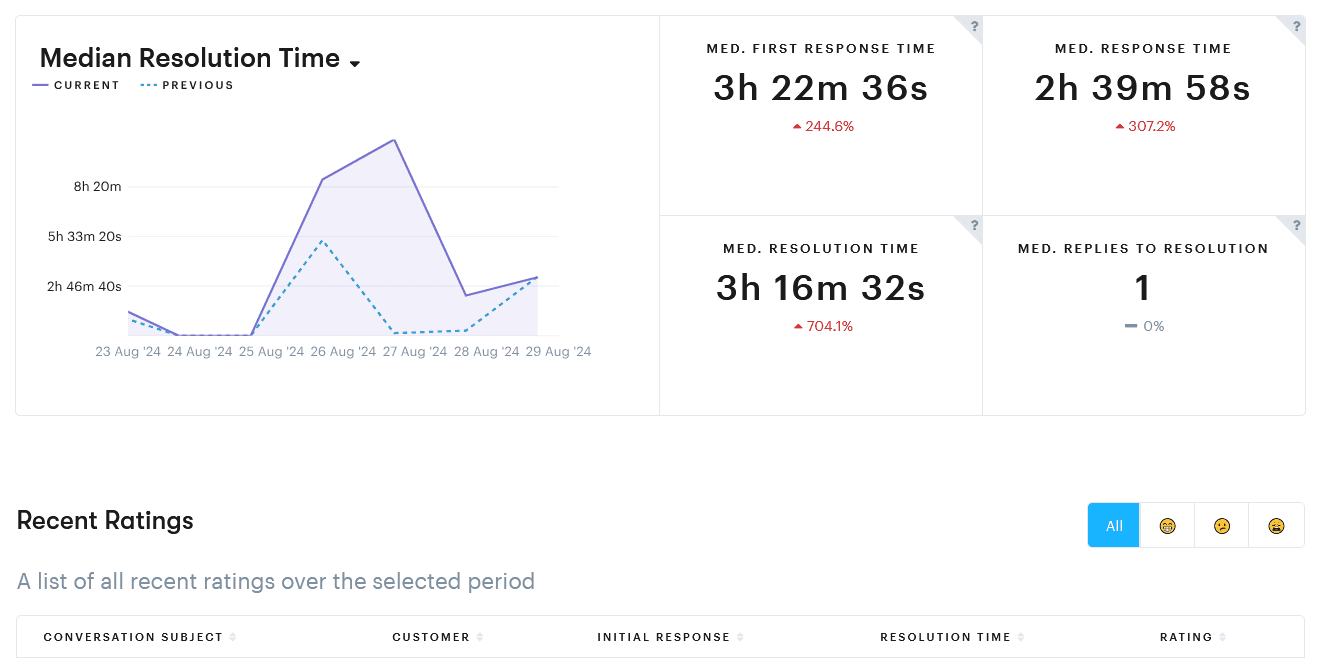
The Productivity Report
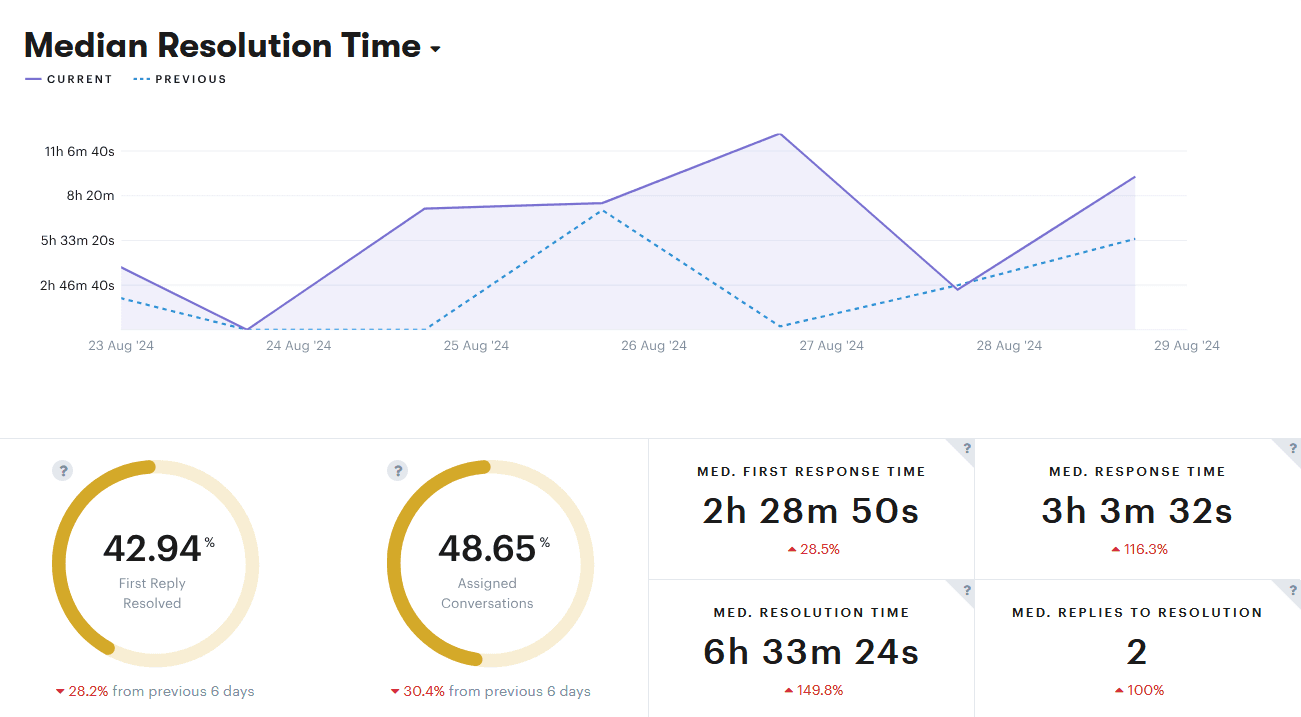
The productivity report shares details on the overall performance of your team. You’ll get data on:
- Resolution times
- First response times
- Median response times
- Median replies required before problems were resolved
- The percentage of conversations that were resolved with a single response
- The ratio of conversations assigned to an agent versus those created by an agent
Fast response and resolution times are crucial for improving CX. Response time represents how quickly you acknowledge and reply to customer tickets. Shorter times show customers that their own time is valued, and drives customer satisfaction and loyalty.
On the other hand, resolution rate measures how effectively your team resolves issues. A high resolution rate means you’re not just responding right away, but also fixing problems and keeping buyers happy.
The Happiness / CSAT Report
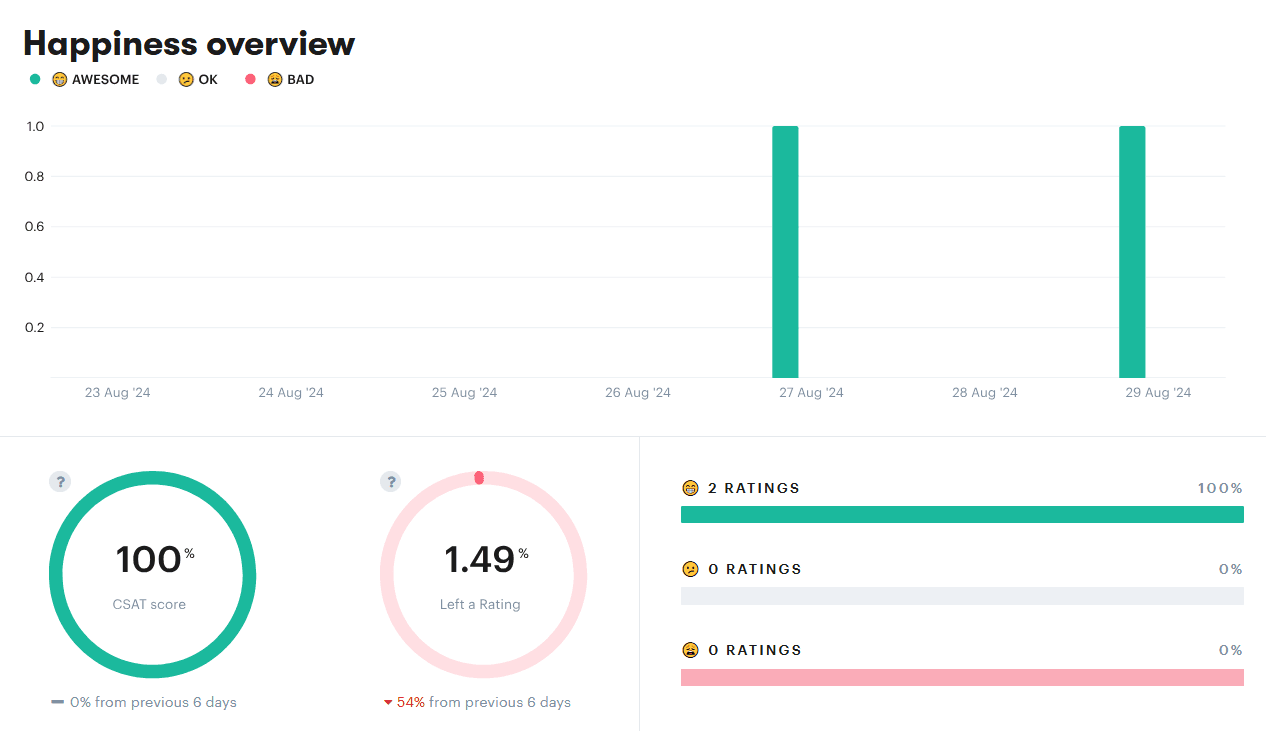
The CSAT report displays a happiness percentage score, calculated from the average of customer ratings via your email form. The percentage in green reflects customers who are happy overall, and the percentage in red represents unsatisfied customers.
What should you be aiming for? A CSAT score above 80% is often seen as a good starting point. However, it’s important to set benchmarks that are relevant to your own business, based on:
- Industry standards. How does your score compare to companies of similar size and type? This helps you understand where you stand in the competitive landscape.
- Internal trends. Track your CSAT score over time. Is it improving or declining, and how quickly? This can reveal the impact of your efforts to improve customer experience, and allow for retargeting.
Along with the raw numbers, don’t forget to review the open-ended survey responses. These qualitative insights often provide a richer qualitative understanding of customer sentiment, and can uncover deep-rooted issues that might not be captured by numerical scores.
It’s also a good idea to categorize and segment the responses. This can be based on demographics, location, purchasing behavior, or any other relevant factor. Segment analysis uncovers hidden patterns – maybe most of the unhappy buyers rely on a particular feature or prefer a specific support channel.
The Teammates Report
This report focuses on your team members’ individual productivity. The information is pulled from customer satisfaction scores, as well as the conversation metrics found in the Conversation and Productivity tabs. You can see each person’s:
- Number of assigned and resolved conversations
- Number of customers helped
- Resolutions per day
- Customer satisfaction scores
With this information in hand, you get a much clearer picture of your team’s performance. Which agents are the best responders and provide the best CX? Those team members might benefit from more autonomy, or invitations into mentorship roles.
On the other hand, who is struggling, and might benefit from more training and one-on-one support? You might even find that most or all of your agents are experiencing certain issues, calling for team-wide intervention or new hires to ease the workload.
The Knowledge Base Report
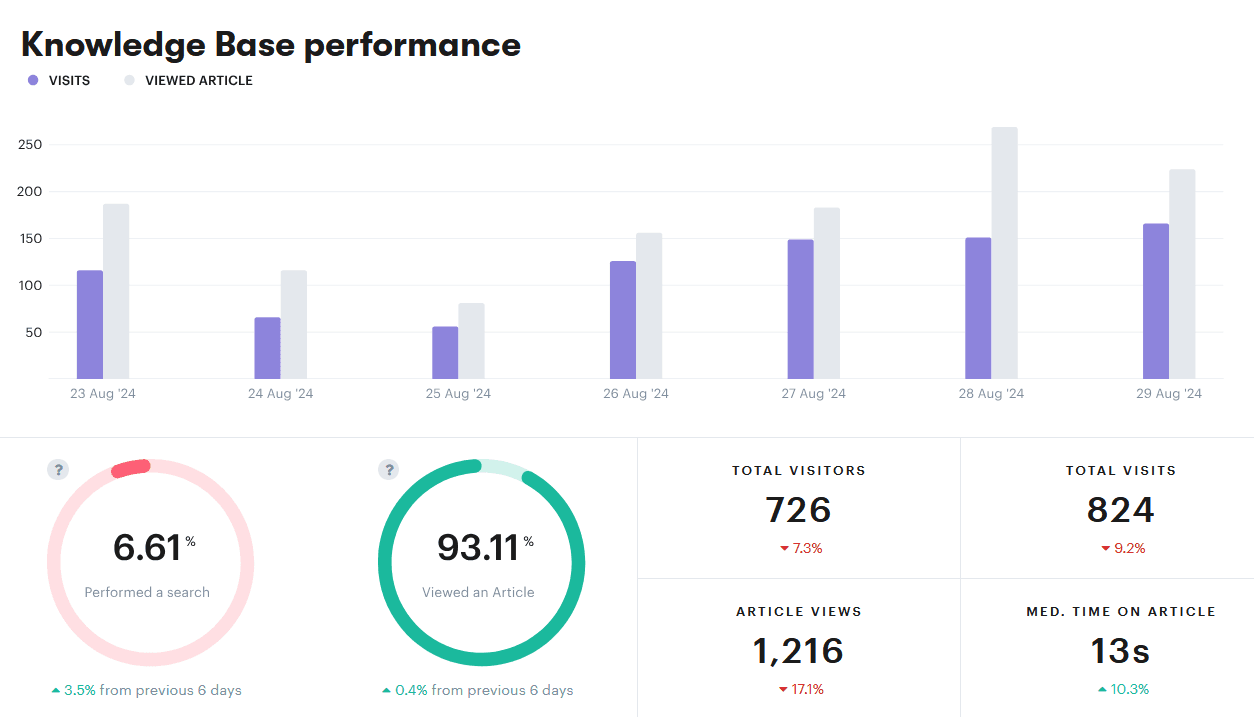
Last but not least, here’s what you’ll uncover via the Knowledge Base report:
- Total visits and unique visitors to your knowledge base
- Median time spent by customers on your articles
- Number of views under each article
- Most viewed articles
- Ratings for individual articles
- Most searched terms
- Information on ‘failed searches’ (when users search for terms but don’t find matching articles or relevant information)
In combination, this information helps you level up your self-service customer support. Pay attention to which specific metrics are lacking.
If many customers visit articles, but spend very little time on them, it’s likely the content isn’t providing what they need. Alternately, high read times and low views indicates that the articles are helpful, but customers are failing to find them or prefer to contact support directly.
Step 4: Leverage Your Collected Data To Improve the Customer Experience
Now that you’ve gathered insights, it’s time to transform them into action!
How you do this will depend on what you learn and what your goals are. But the most important guideline to follow is this: Make sure to contextualize your data and fully understand the source of an issue before making changes.
If all you know is that your customer support is lacking, for example, you could spend a lot of time trying to improve things that aren’t actually broken. You need more specifics.
Are response times high because your service workflows aren’t optimized? Are customers leaving interactions upset because they aren’t being treated with personalization and empathy?
So take the time to consider all of the data you’ve collected, and contextualize it alongside everything else you know about your audience. If that’s still not enough, this would be a good time to send out surveys to identify more precisely what pain points customers are experiencing.
Common CX Problems and Effective Solutions
Once you’ve done the necessary groundwork, you can start making targeted changes to improve CX elements. Here are some examples of problems you might identify, and the resulting solutions you can try:
- Customers are frustrated by slow response times. Define achievable targets for response and resolution times based on industry standards, to guide your team and set clear standards. If you have a small team, you can send out immediate automated responses to acknowledge receipt, and have agents follow up as soon as possible.
- Your team can’t keep up with customer inquiries, leading to delays or subpar service. Implement rules to quickly handle routine messages, allowing your team to focus on more complex issues. Round robin ticket assignment also ensures that work is evenly distributed.
- Customers feel a lack of respect/care in their interactions with your business. Personalize the CX by using historical data to tailor your responses, and employ templates and tags to customize messages more effectively.
- Your team is providing inconsistent service due to a lack of knowledge on best practices. Regularly empower and train support staff to develop their soft and hard skills.
- Customers don’t feel they have access to the self-service options they need. Optimize your knowledge base by regularly reviewing and updating content, adding visuals to make instructions more clear, or allowing readers to leave questions and comments.
Finally, keep an eye out for trends that indicate a problem in the making, even if it’s not fully realized yet. Proactive issue resolution can really set your business apart. This could mean reaching out to customers who might be affected by known issues and providing additional resources, or jumping in with an intervention as soon as you see a key metric begin to dip.
A Few Final Tips for Creating a Data-Driven Customer Experience
Before we wrap up, let’s go over a handful of ways you can really maximize the power of your customer data:
- Keep detailed records of customer interactions. Put a system in place for tracking customer care issues on both an individual and business-wide level. The more of this qualitative information you can gather now, the better positioned you’ll be to use it alongside quantitative data when needed.
- Integrate your helpdesk with other key platforms. It’s much easier to contextualize data if you have a central hub for all of your customer information and interactions. Groove offers seamless integrations with popular CRM systems, various marketing platforms, and other support channels like live chat.
- Adopt a data-driven culture. Encouraging a data-driven culture starts by making information accessible and easy to understand for everyone who might need it. Encourage team members to use data to guide decisions and improve processes, and regularly share insights and celebrate successes.
Analyzing metrics to improve CX isn’t something that should only happen one time – or even just once a year. Instead, consider taking steps to create a more data-driven, efficient, and customer-focused day-to-day environment. This approach not only enhances customer satisfaction, but also supports sustainable growth.
Growing Your Business Through Careful Application of Data
Understanding your customers is key to success in any industry. So is knowing exactly how your business is performing, and where its CX may be lacking.
By tracking key metrics like CSAT and resolution times, you gain valuable insights into customer satisfaction and pinpoint areas for improvement. More broadly, cultivating a data-driven culture for your entire team empowers informed decision-making, leading to better customer outcomes.
And as your business grows thanks to those improvements, Groove scales alongside you. Ready to unlock the power of data to maximize the customer experience? Try Groove out for free today!
5 Help Scout Alternatives: Why Growing Support Teams Switch to Groove
Groove Fixes What Teams Don't Like About Help Scout: Flat Pricing, Built-In AI, and Native SLA Management. See the Full Comparison.
How Helply's Hallucination-Proof AI Eliminates the #1 Fear of AI Customer Support
Customer Support Automation That Hits 65% AI Resolution, Guaranteed. Helply's Action-Based AI, Safe Escalations, and Optimization.
