
How To Track and Use Real Time Customer Insights

Traditional customer data from surveys and the like is useful, but limited. Sometimes, you need information that’s more immediate. Memory is inherently biased, and once a customer responds through traditional methods it may already be too late to take action.
Damage control isn’t ideal. It’s a lot better to avoid problems proactively. Real time customer insights help a great deal with that. We’ll talk about what you can track, then explore how you can leverage tools to gather real time customer insights and improve CX.
What Are Customer Insights (And What Can They Do For Your Business)?
The process of gathering customer insights involves collecting data on everything about your buyers and their customer experience (CX). That includes their characteristics and behaviors — wants, needs, personalities, and so on.
It also encompasses their feelings and experiences at various touchpoints with your brand. How do they feel about your customer support? Do they understand how to navigate the free trial sign-up on your landing page?
Customer insights can be collected through market research, surveys, tools, observations, and customer feedback via reviews. You’re looking for trends like:
- One segment of customers prefers to shop on their phones, another on their laptops
- A particular type of subscribed user doesn’t use one of your product’s key features
The Benefits of Collecting Customer Insights
So what can these insights actually do for your business?
On the big-picture level, customer insights help you better understand your target audience. Beyond that, it provides actionable information you can use to:
- Learn what your target audience expects from you
- Improve the buying experience
- Improve the onboarding experience
- Get a clear picture of behavioral trends, which can be leveraged for marketing campaigns
- Identify the reasons behind churn
- Spot (and correct) pain points and friction across the customer journey
- Fix CX problems
- Maximize customer lifetime value
When you collect customer data and mine it for actionable insights, you learn what it means to be one of your buyers. And you get a better understanding of what you need to do to make things easier and more appealing for them.
In other words, the aim is to increase the quality of your products/services, by discovering what’s lacking from the customer’s perspective and making targeted changes.
What Does It Mean for Customer Insights To Be in ‘Real Time’?
Real time customer insights are instantaneous. For example, they can be used in-the-moment by support agents, even as they communicate with customers.
We can compare this to a more traditional approach, which usually involves collecting customer data through surveys, interviews, focus groups, customer development, or market research. This is immensely useful, but it takes time to gather the information, analyze it, and learn from it.
In most cases, it also involves more active work from your CX team. By comparison, real time customer insights are often automatically (or passively) collected through tools.
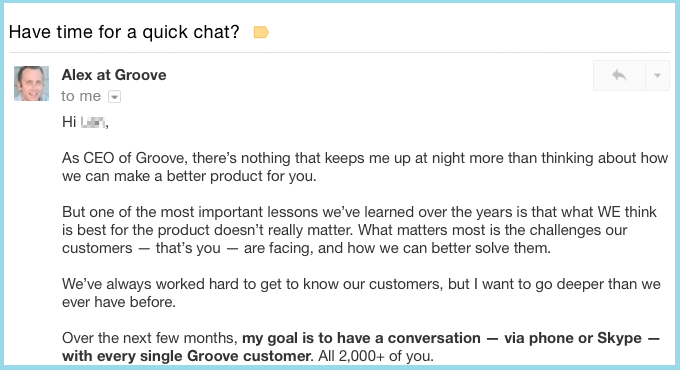
In the past, at Groove we’ve used a number of different methods to gather feedback. The early days involved a ton of leg work — which was not in real time. We would contact and speak with customers on a one-to-one basis, then compile the data manually. It was extremely valuable, but only possible in the early stages of our start-up.
As your business grows, that kind of customer development only does so much. The proportion of your buyers you can gather information from in-depth becomes smaller, and less representative of your overall audience. Which makes it necessary to start automating data collection before you reach that point.
3 Steps for Tracking and Using Real Time Customer Insights
Few challenges your business will face are greater (or more important) than understanding the drivers of customer behavior. If you’re not yet collecting real time customer insights, here’s how to get started.
1. Set Up Your Tools and Start Gathering Data
While a researcher can’t follow around a customer 24 hours a day, data tracking tools can collect information at any point in the customer’s journey — without the need for manual intervention.
Your first step is to create a comprehensive list of all your customer touchpoints (e.g., visit to blog, onboarding, sign-up). To do this, you’ll want to properly map out the customer journey before you dive into data tracking.
Common customer touchpoints include (but aren’t limited to):
- Online ads — PPC, Meta, etc.
- Live chat widgets
- Social media posts — influencer, organic, or sponsored
- Blog posts and landing pages
- Referrals
- Email campaigns or newsletters
- Customer service
- Product reviews, surveys — CSAT, NPS, CES, etc.
Next, you’ll need to set up tools that allow you to gather data across those touchpoints automatically. Exactly what you’ll require depends on what you’d like to track. Here are a few useful (and budget-friendly) places to begin.
Groove: CSAT and NPS Survey Data
First up, you’ll want a way to gather immediate feedback on customer satisfaction. There’s no more valuable insight than whether customers are happy with your business (or if they aren’t, exactly who is unhappy and why).
This data is easy to collect automatically, if you use a customer support helpdesk with built-in reporting. Helpdesk software is used to organize and respond to customer inquiries more effectively via a shared inbox.
Our own helpdesk, Groove, is built to assist small businesses in providing the best possible CX. So naturally, it offers options for tracking customer insights in real time.
CSAT Ratings
If you’re a Groove user, the first thing you’ll want to do is enable automatic CSAT ratings. This gathers real time customer insights on the quality of your customer service team.
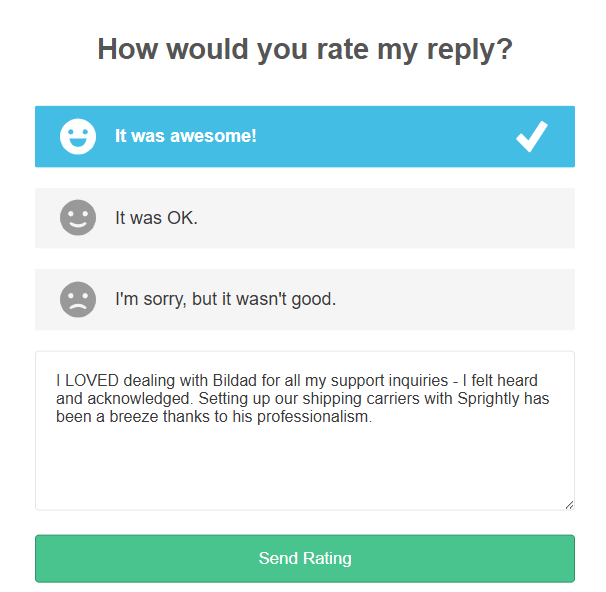
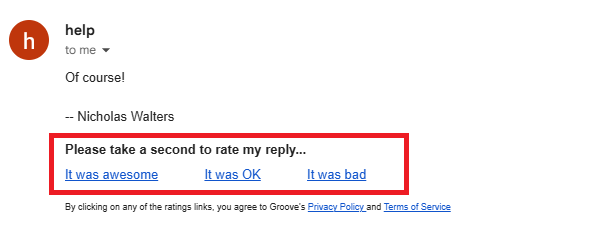
A CSAT survey (which you can customize) is embedded automatically at the end of a support conversation. It asks customers to immediately rate the level of service they received. They can provide a simple good/neutral/bad rating, along with more in-depth feedback if they choose.
There are five ways to monitor the collected insights from CSAT ratings in real time:
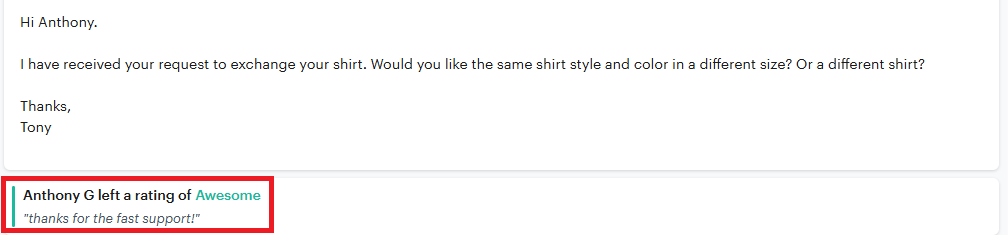
1. Check Embedded Rating in Customer Conversation: The easiest way is to look for the corresponding rating and response on the resolved ticket, which appears automatically once the CSAT is submitted.
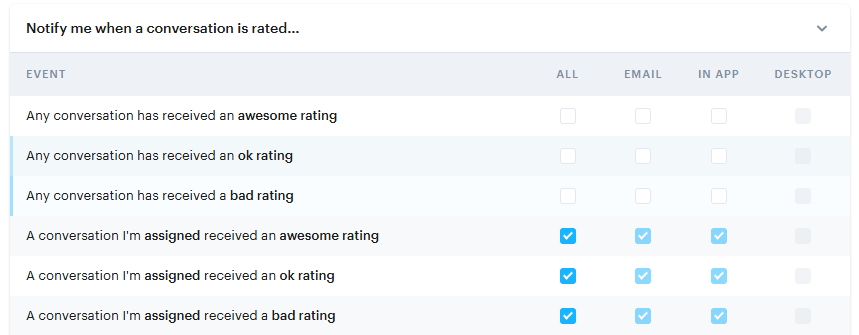
2. Email Notifications: Under Settings, select Personal → Notifications. Your team will automatically receive an email each time you get a rating, which you can then investigate.
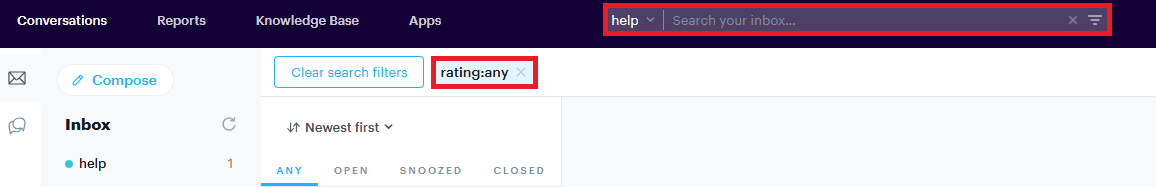
3. Search Conversations by Rating: You can search for rated conversations by entering “rating:any” in the search bar. You can also search for a specific rating by entering the rating type (e.g., “rating:ok”). Lastly, you can see ratings for a specific customer by combining “rating:any” and “assignee:user”.
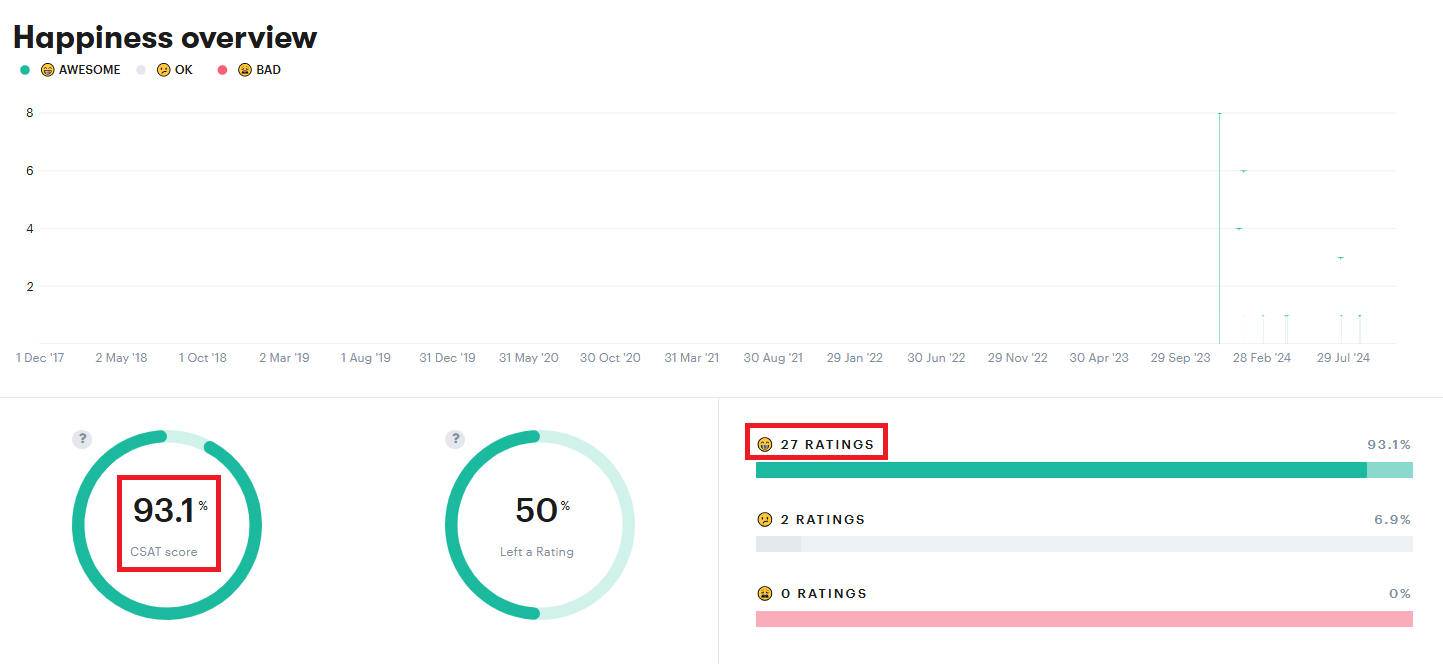
4. View Happiness Reports Under Reporting Dashboard: All CSAT information as it relates to a specific agent or interaction can be found under Reports → Happiness.
5. Slack Notifications: Groove integrates with Slack. You can ping a channel every time you get a rating to have a specific department put eyes on it ASAP.
Net Promotor Scores
Instead of measuring satisfaction as it relates to a specific interaction, Net Promotor Score (NPS) measures the likelihood that a customer will recommend your business to others. So while CSAT ratings provide insights into given touchpoints, NPS gives you a picture of overall satisfaction.
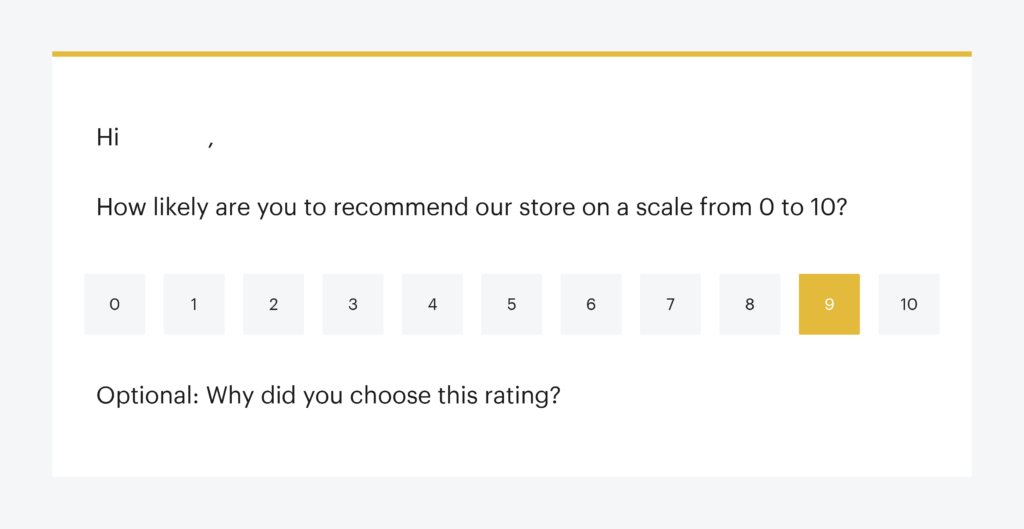
Groove integrates with Delighted, which you can use to send out NPS surveys and collect the results. Customers are asked for a rating from 1-10, and provided an extra field to explain why they chose their score. Customers are then categorized as Promoters, Detractors, or Passives (neutral).
You can either use Delighted’s platform to interpret NPS results in real time, or connect it to your Groove inbox to automatically receive feedback.
Once a survey response is received, a ticket is created. You can configure the settings if you like so that tickets are only created for “Detractors” or low scores (allowing for an immediate follow-up).
Google Analytics 4: Realtime Report Web Data
For the most part, Google Analytics 4 (GA4) is not a real time tool. Data is only available after a certain period .
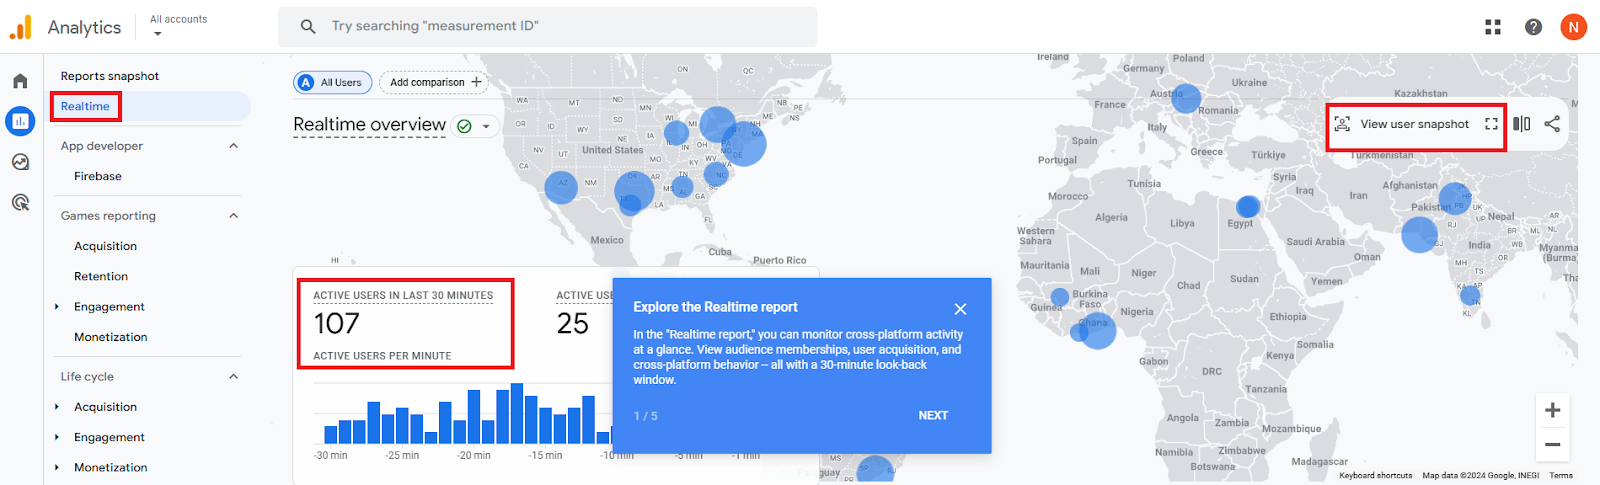
However, there is a ‘”Realtime report” feature that allows you to track some site/app data on a rolling basis. It shows events and quantitative data, and can be accessed by going to Reports and selecting Real-time.
From this dashboard, you’ll be able to see the people who are currently on your website or mobile app.
Through the GA4 Realtime Report, you’ll be able to identify:
- Active Users: See the number of users currently browsing your website.
- User Engagement: Track real time user interactions, such as adding items to carts, searching your site, or clicking on specific elements.
- Traffic Source: Identify where website traffic comes from (organic search, social media, paid advertising, etc.)
- Trends: Spot sudden surges or drops in traffic and investigate their causes.
- Campaign Success: Monitor the immediate impact of new marketing campaigns or website changes.
- Technical Issues: Notice and assess any technical problems that might be affecting user experience.
- Conversions: Monitor the completion of your goals (purchases, sign-ups, etc.).
Qualaroo: In-App and Web-Based Micro-Surveys
For even more depth, you can invest in a dedicated platform for real time customer insights. Many of these are expensive and complex, but Qualaroo is a handy budget option that still gets the job done.
Qualaroo’s Nudge feature collects real time insights while customers browse your website or app. It helps to automate the process of creating email surveys, with targeted on-page or in-app prompts.
You can target customer segments based on:
- Specific on-page or in-app actions: Prompt customers based on predetermined actions, like when they use a certain feature.
- Triggered events: Track experience during a specific event, like a sale or campaign.
- Domains: Send surveys to specific domains.
- Subdomains: Send surveys to specific subdomains or site sections.
- Display per visitor frequency: Survey customers exclusively on their first visits.
- Recurring customers: Engage customers with periodic surveys to track improvements.
- Duration on page: Send surveys based on the time customers spend on a page.
- Exit intent: Gather feedback from customers who are about to bounce.
- Scroll location: Survey customers based on scroll depth to determine their level of engagement.
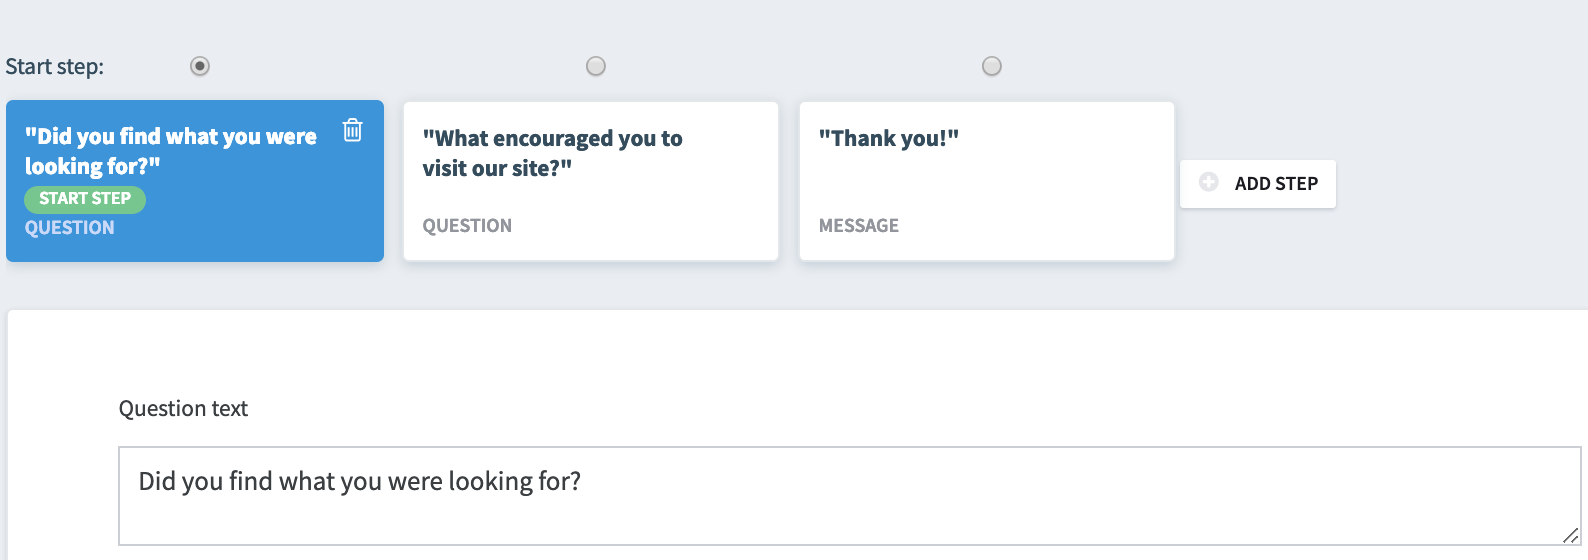
You can select pre-written question templates, or create your own from scratch to gather whatever real time insights are most valuable for your business.
2. Assess the Data and Look for Trends
Collecting customer insights is half the battle. The real work is taking all that noise and pulling useful, actionable insights from it.
When reviewing qualitative and quantitative data for insights, you’ll want to look out for key drivers. These drivers result in behaviors and actions you’d like to avoid or encourage. For example:
- Does one CTA lead to higher conversion rates than another?
- Are customers who rely on a specific feature more likely to bounce?
- What types of interactions do customers tend to leave positive vs. negative reviews for?
Analyzing drivers can inform you which touchpoints are correlated to what type of customer behavior. Remember to pay close attention to any drivers related to support, since customer service is the biggest driver of growth for most small businesses.
You can also consider how interactions connect into a ‘touchpoint chain’. This helps you identify parts of the process where you tend to lose customers, or that have broken down entirely. A consistent omnichannel experience is vital for ensuring a frictionless journey across touchpoints and between channels.
Let’s look at a few examples of how you might dig into and evaluate the real time customer insights you’ve gathered.
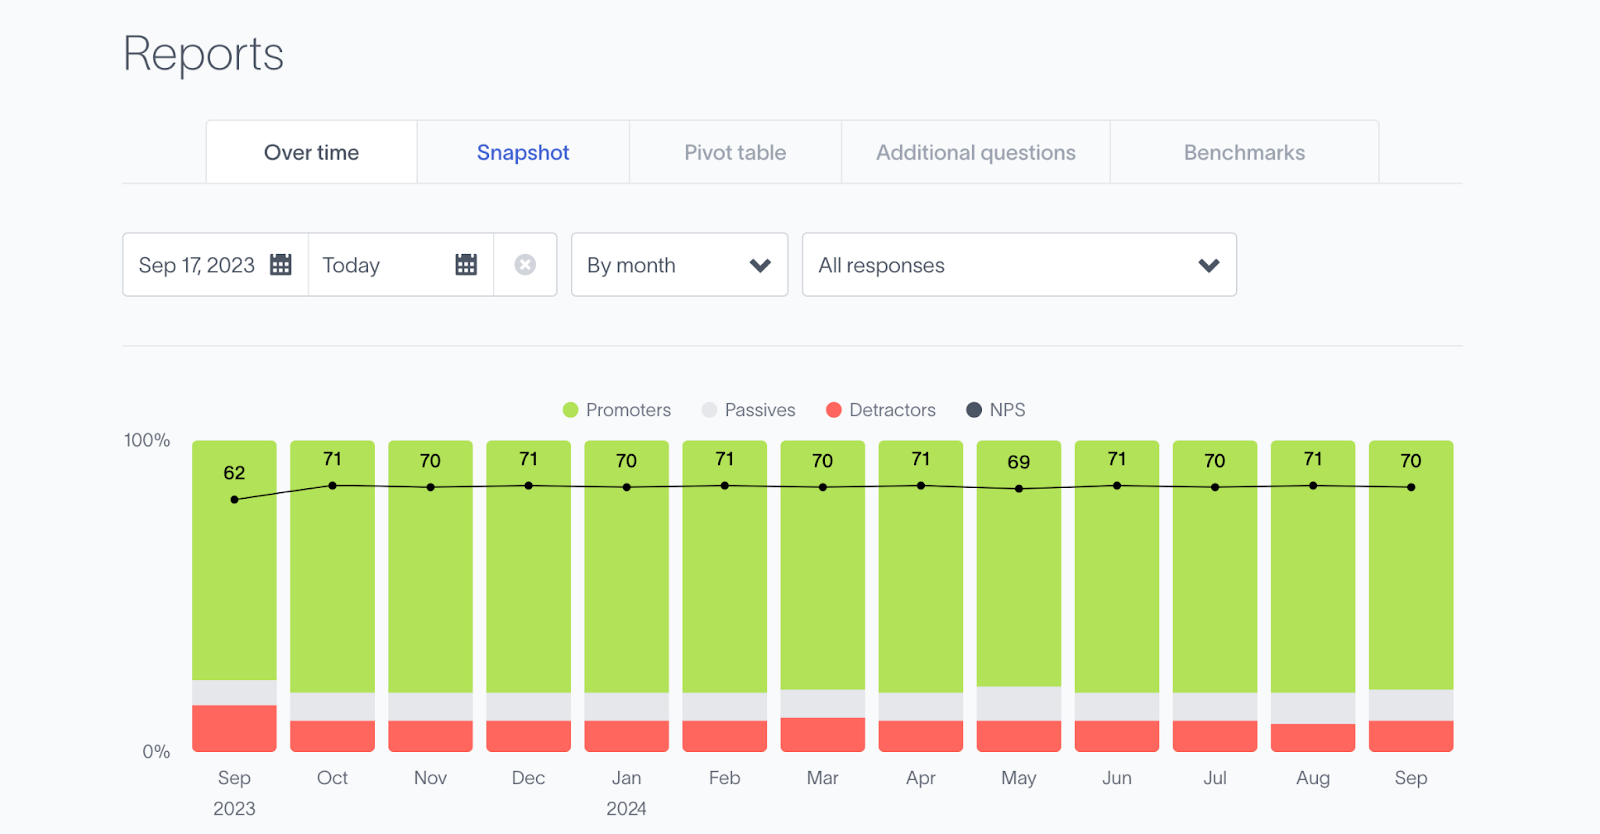
Assessing NPS Survey Data
Your NPS score is calculated by subtracting the percentage of detractors from the percentage of promoters. It’s then measured on a -100 to +100 scale:
- 70-100 = Exceptional
- 50-70 = Excellent
- 0-50 = Good / Fair
- -100-0 = Bad / Poor
Let’s say your business sends out an NPS survey to gauge customer satisfaction after a major product update. Your team is pretty happy with the new features, and hopes they’ll lead to increased satisfaction.
A positive NPS score (50+) is a good sign. A negative score (-100-0) might indicate some sort of issue with the update. However, it’s vital to correlate that score to internal benchmarks, goals, and previous ratings to better understand the impact of your upgrade.
Perhaps the score is negative, but still significantly improved. On the other hand, perhaps there was a steep drop in the weeks following the update.
The important point is that these starting insights are only correlations. You’ll need to dig deeper to determine what’s causing a poor NPS score (or any other sub-par metric). Look for trends, such as a drop in scores whenever a new update is released, and then follow up with customers to get more details on the potential causes.
Assessing Real Time Google Analytics Data
In GA4’s Realtime report under “Overview”, you’ll be able to immediately see traffic across your website or app. You can use this data to determine where customers are located, how they navigate your website, and how they found your business in the first place.
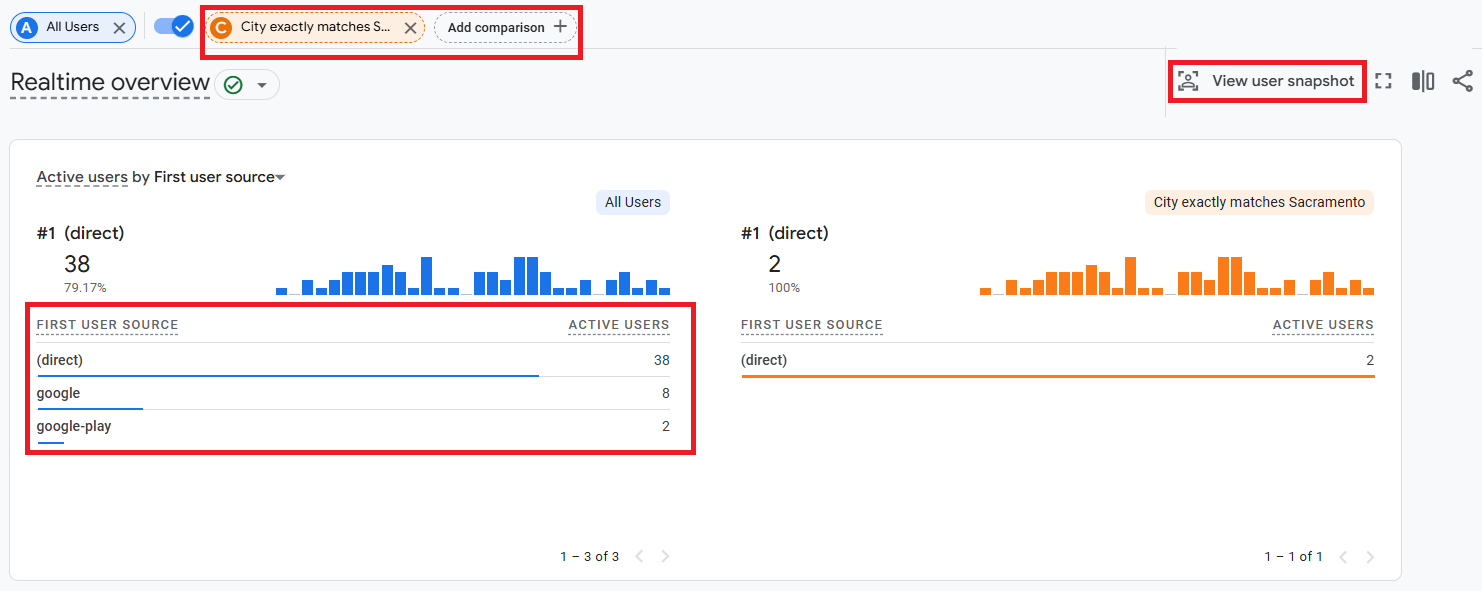
If your report shows 0 total visitors, you’ll want to make sure your GA4 code was installed properly. With that sorted, the Realtime report contains two main sections. The bottom half features “Insight” tiles, and the top half contains an interactive user map.
Hovering over a portion of the map tells you how many visitors from that region are on your site. When you click on a highlighted area, you add the location as a “Comparison”.
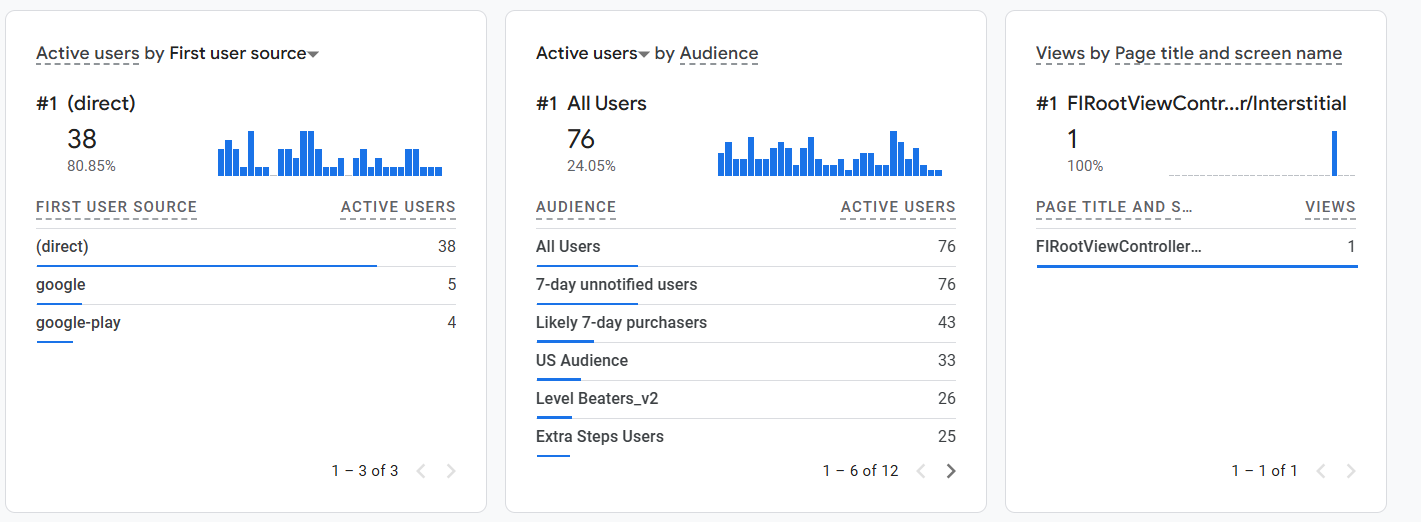
The “Insights” user cards offer more granular details. There, you’ll be able to see all the active audiences on your website or app. You can then compare all active users against the audience of your choice.
Selecting “View User Snapshot” shows you (at random) the activity stream of one user as they navigate your website.
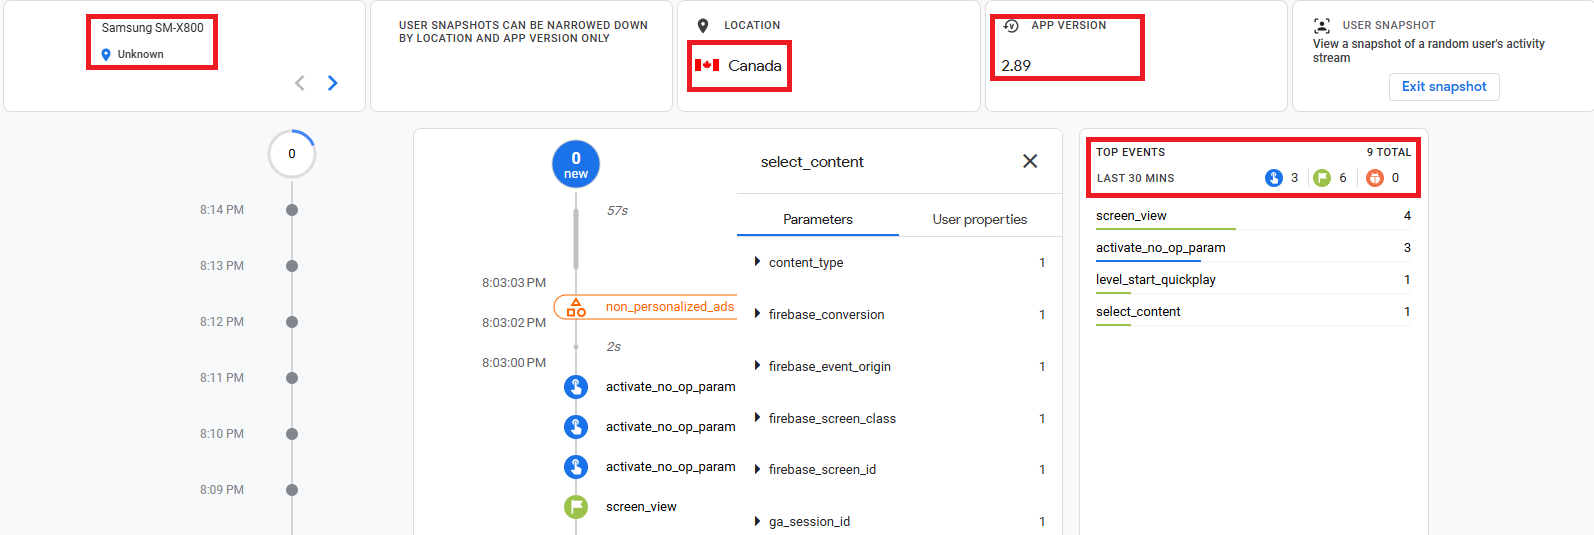
This activity stream shows you information pertaining to:
- The user’s device
- The app version
- Location
- Relevant user properties
- Top events triggered by the user
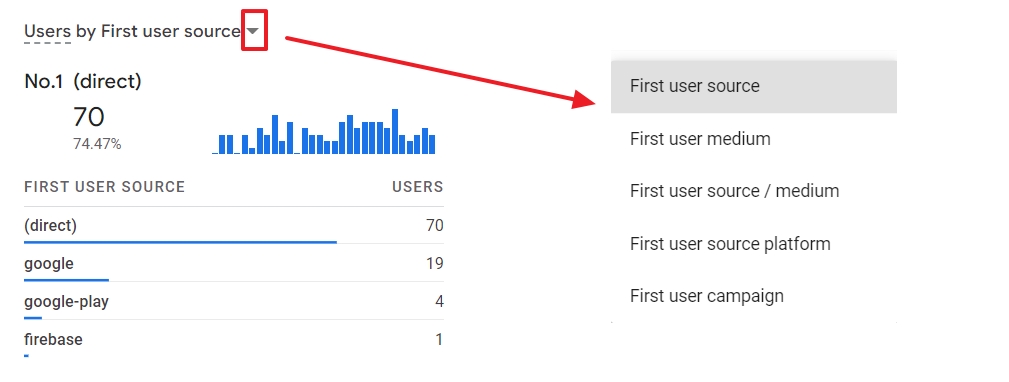
These Insight cards contain user data relating to the first user source (did they land directly on your website, or come from Google), and the platform or campaign (PPC, etc.). In other words, this shows you how current visitors found your site.
You can leverage all of this data to assess the effectiveness of your website and marketing campaigns. The gathered insights are perfect for driving experiments and improvements.
3. Implement Real Time Customer Insights To Improve CX
Let’s say you spend time with the GA4 Realtime report, and determine that customers are having trouble navigating your website efficiently. Or maybe they’re not using a specific app feature you want to encourage engagement with.
At this point, it’s time to start taking action. The end goal is to help your customers experience success with your product or service. That means improving the CX and UX, eliminating unnecessary touchpoints, and so on.
There are so many ways to improve the overall customer experience by leveraging insights. What’s most important is to:
- Make planned improvements based on analysis and context. Even if you’re looking at real time data, don’t start making changes the moment you see something that looks wrong. Take your time to investigate until you’ve found the source of the issue, or at least a few top candidates.
- Implement small, targeted changes. Sweeping adjustments to your product, website, etc. tend to backfire and create new problems. Consider the smallest tweak you can make that may address the issue, and start with that.
- Monitor your changes. Don’t give up tracking insights now. Keep a close eye on those real time metrics to see whether you’ve had an immediate, tangible impact. The quicker the improvement materializes, the more likely it was a result of your actions.
- Be transparent with customers. Keep your buyers in the loop! Let them know what you’re changing and why, and give them advanced warning if it might affect their use of your product/service. This is a great time to ask for more input as well.
To illustrate, perhaps many of your SaaS users are failing to use a particular feature. Those same users tend to bounce after a few months, and you’re pretty sure there’s a connection.
You might jump to assuming there’s something wrong with the feature, and start planning a complete overhaul. While that may end up necessary, you can start a lot smaller.
Perhaps you survey customers and find that they tend to be unaware the feature exists, or unsure how to use it. In that case, clearer prompts and documentation might be all you need. You can encourage product education through a self-service resource like a knowledge base.
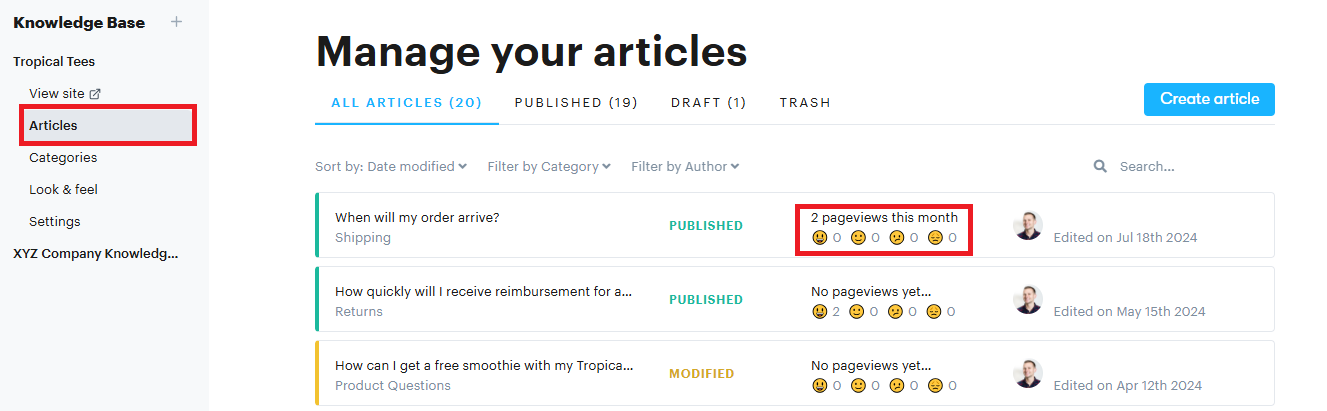
Groove makes it easy to set up a knowledge base for your customers to reference. The entire support team can collaborate on adding information, pulling from internal knowledge or collective experience:
Once you have better documentation on the feature in question, you might create a canned message summarizing the feature’s use cases and linking to key resources. You can personalize the message and send it out via Groove to customers in the high-risk group you identified.
Then keep an eye on those real time sources! If they don’t improve to your liking, you can try other strategies and even adjustments to the feature itself, until you’re confident that the bulk of your users are able to use it effectively.
Embrace Real Time Customer Insight To Provide Exceptional Service Today
Real time customer insights are more useful than ever, as they’ve become more readily available and easier to understand for non-experts. Negative reviews and frustrating user experiences impact your reputation and bottom line, which makes real-time data tracking essential to longevity.
The quicker you can gather information about your customers and make adjustments, the more you keep short-term issues from becoming long-term problems. At the same time, it’s still vital to assess and respond to real time customer insights carefully and thoughtfully.
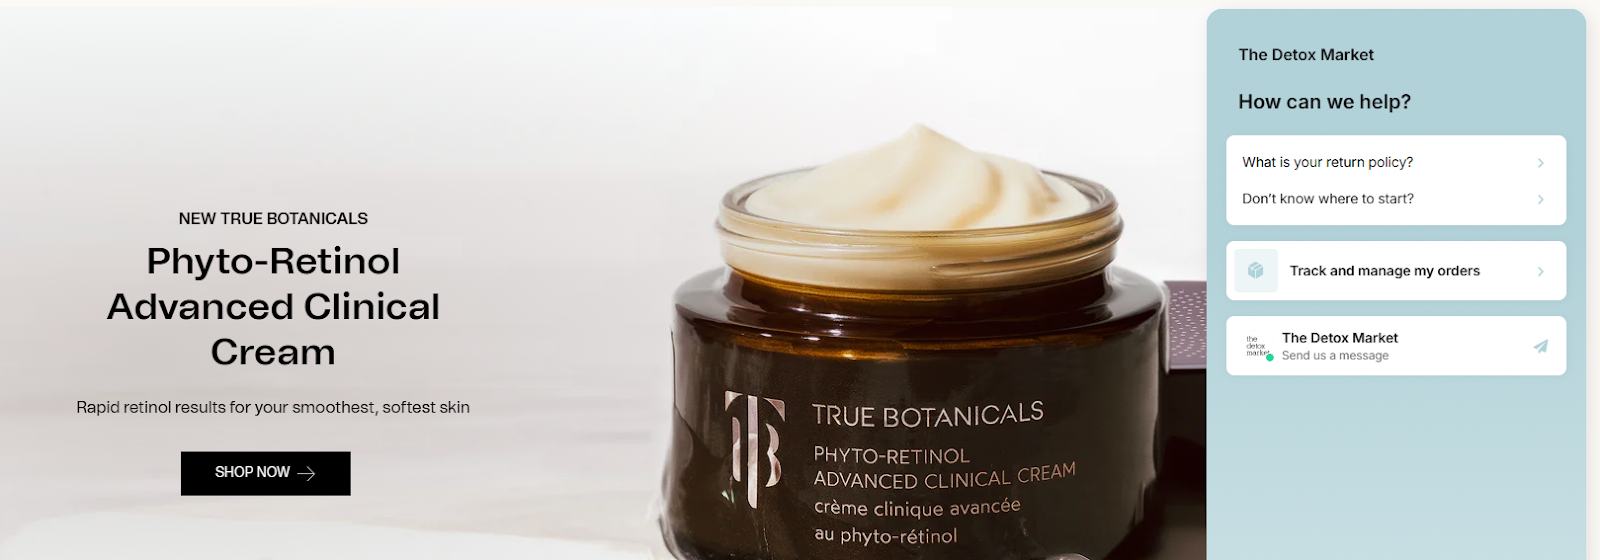
Groove enables you to act on real time customer insights across all CX touchpoints — thanks to data tracking, proactive automation, customizable triggers, self-service options, and a powerful live chat widget. Sign up for a free trial, and experience the benefits of a customer-first help desk in real time!
What Is Intelligent Customer Experience? (Plus 5 Steps for Making It a Reality)
You’ve poured your heart and soul into creating a product you’re proud of. But lately, you’ve noticed a troubling trend. Your customers aren’t as engaged as they used to be. And your poor support team? They’re drowning in a sea of tickets. Success isn’t just about having a killer product. It’s about providing exceptional experiences […]
How To Develop a Winning Digital Customer Experience Strategy
Finding it difficult to determine how customers interact through your digital channels? Maybe your buyers have a hard time moving from one channel to the next with your brand? If your business fails to create a personalized experience across all channels, you’ll face low engagement rates, high bounce rates, and hampered customer satisfaction. The solution? […]
