
How To Track the Customer Journey (And Use What You Learn!)

“Now more than ever we need to talk to each other, to listen to each other and understand how we see the world.”
When he said that, Martin Scorsese was talking about the power of cinema as a cultural medium. But the truth behind his words applies just as well to customer support.
Let’s say your small business is attracting plenty of leads online, but experiencing a high bounce rate right before the point of conversion.
Where’s the problem? A shallow conversion rate signals some kind of friction in the customer journey. But how can you identify where that friction is and what you should change?
Understanding how people move through the process of awareness to purchase (and beyond) provides transformative insights. Once you know how to track the customer journey, you can determine which touchpoints result in bounce or churn, and make targeted improvements.
The Customer Journey in a Nutshell: What You Really Need To Know
The first step in learning how to track customer journey is a basic understanding of the process. You’ll also need to create a ‘map’ of the ideal stages your unique buyers will go through.
If you have all that in hand, feel free to jump ahead! If you’d like a refresher, though, let’s touch on a few basics.
The Marketing Funnel vs. the Customer Journey
The marketing funnel is not customer centric.
It visualizes an idealized version of the customer journey as buyers move from awareness to conversion. It’s referred to as a funnel, since it starts with a broad range of inputs and narrows as time goes on.
The customer journey flips that perspective entirely. It maps out the process from the perspective of the buyer – what they’ll actually do, not what you hope to ‘force’ them to do.
This allows for a more customer-centric and holistic approach. It places you in the buyer’s shoes, and provides an accurate context for understanding how they move through pre-purchase awareness into post-purchase use.
A marketing funnel is typically more rigid, too. There are concrete stages, often divided into ‘awareness’ (top of the funnel), ‘consideration’ (middle of the funnel), and ‘conversion’ (bottom of the funnel). Analysis can become more granular, but these stages represent the three primary sections of any marketing funnel.
In contrast, customer journey mapping is broader and more fluid. It still uses stages – even some of the same ones – but it’s meant to be flexible. Customers can easily revisit earlier stages or jump across touchpoints without ‘breaking’ the process.
Typical Stages of the Customer Journey
A customer journey map is organic, and encompasses the full breadth of the customer experience. It covers all the touchpoints they have with your company.
The concept was developed to help companies understand the full range of consumer behavior and purchasing decisions. It dates as far back as the 1990s, with a published paper called “The Experience Economy” setting the stage.
Because the customer journey is holistic, there are different names for the core stages. The following five are some of the most common:
- Awareness
- Consideration
- Decision or Purchase
- Retention or Loyalty
- Advocacy
Note that the scope here is broad. The map doesn’t end with a purchase – that’s just the midpoint. It follows the customer through the entire lifetime of their experience with your business.
Mapping the Customer Journey
Before you can learn how to track the customer journey, you need to know what you’re tracking. So if you haven’t already, we recommend creating a thorough customer journey map before you proceed any further.
We won’t delve too deeply into that topic here. We’ve detailed the process of customer journey mapping elsewhere. However, it’s important to reiterate that your map should span from initial awareness through engagement, all the way to long-term relationship building.
It should also be highly customized, plotting how your target audience personas travel through those stages. You’ll need a mix of data sources to map out multiple potential journeys that focus on different touchpoints, and speak to various audience segments.
This may sound complex, but at its core, the mapping process is a way of visualizing customer touchpoints and how they interact. Creating a clear map helps you delegate resources, develop marketing campaigns for each step of the customer journey, and more.
What Customer Journey Tracking Means for Your Business
The customer journey encompasses all aspects of how buyers feel about your business. Analyzing it can provide you with actionable insights.
What you learn may inform how you approach marketing channels or customer support. It also helps you identify which areas of improvement directly affect the overall CX or UX (or both).
In other words, an understanding of the customer journey is an understanding of the public perception towards your business.
For example, let’s say your website takes too long to load. You experience a high bounce rate before customers reach the next touchpoint, which reveals a clear UX issue. Now you know what needs to be solved to help potential customers transition.
Conversely, let’s say you see a high degree of customer satisfaction resulting from a live chat widget on your website or in-app. The feature also cuts down dramatically on tickets. You can use that information to more effectively re-tool customer service offerings, such as by investing time into creating self-service resources.
Knowing how to track the customer journey also:
- Allows for better customer relations management
- Helps assess the quality of user experience and customer experience
- Provides actionable insights across channels
- Makes it easier to decrease churn rate and deliver improved support
Preparing to Track the Customer Journey: Setting Up Your Tools
Dedicated tools are necessary to effectively map and collect much of the data you’ll need. Fortunately, if you’re short on resources, you don’t need to start with fancy solutions.
Google Analytics is free, and is a great resource for customer journey tracking:
The latest version, Google Analytics 4 (GA4), can help you measure engagement and site traffic, optimize campaigns, and understand the entirety of the customer journey from awareness through loyalty.
It provides a lot of data, and you can use it across multiple platforms or devices. We’d recommend it to just about any small business or startup.
If you aren’t already set up on Google Analytics, it’s not too hard to get started. In a nutshell, to use GA4 to analyze the customer journey you’ll need to:
- Create a property
- Set up your tracking code
- Create goals and events
Creating a Property
A ‘property’ in GA4 refers to any website or mobile app.
Your GA4 account can support up to 2,000 properties. You probably won’t need that many! But let’s say you have both a website and a mobile app; you would create a separate property for each.
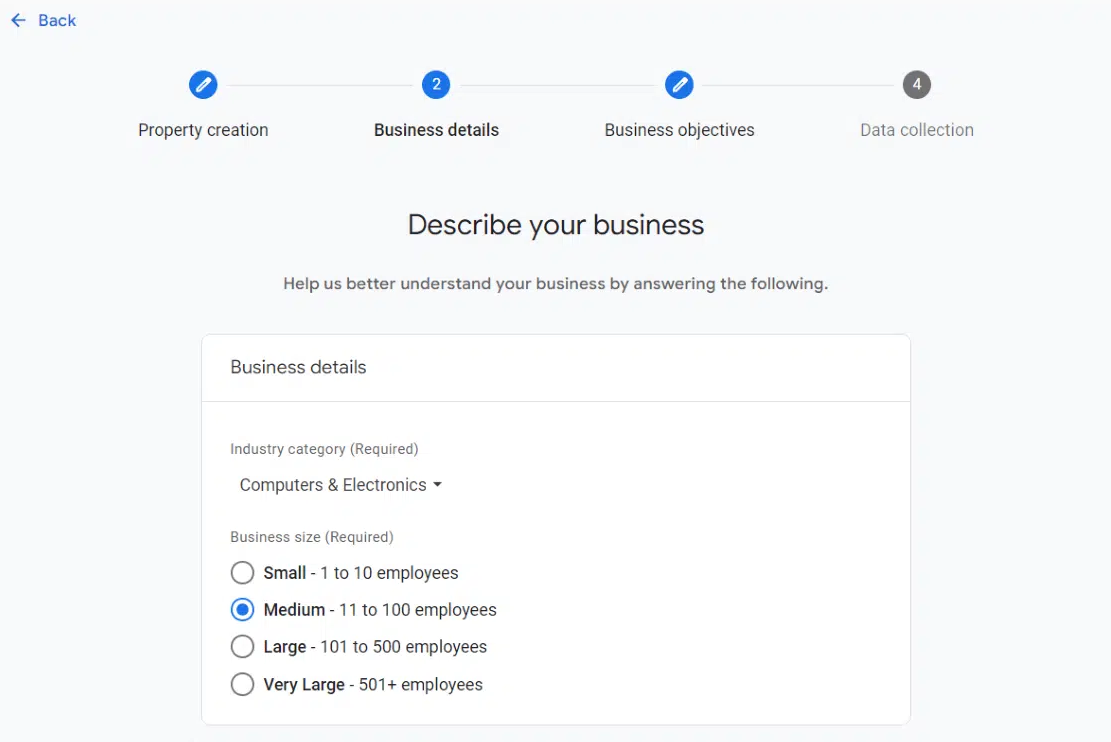
Once you’ve logged into your Google Analytics account, you can select which website you’d like to add a new property for. Then you’ll enter the details for your website, including industry category and business size.
Finally, you’ll choose your objectives. We’d recommend starting with “baseline reports”, so your account is populated with a baseline source of metrics to measure against.
Setting Up Tag Manager
Google Tag Manager pulls data from your website and sends it to other platforms. It allows you to easily update or add tags that connect to Google Analytics, without having to manually write code.
You’ll first need to create an account from the Google Tag Manager dashboard. Then you’ll set up a ‘container’, which acts as a bucket for all of the macros, rules, and tags.
Once those steps are completed, you’ll have two pieces of code:
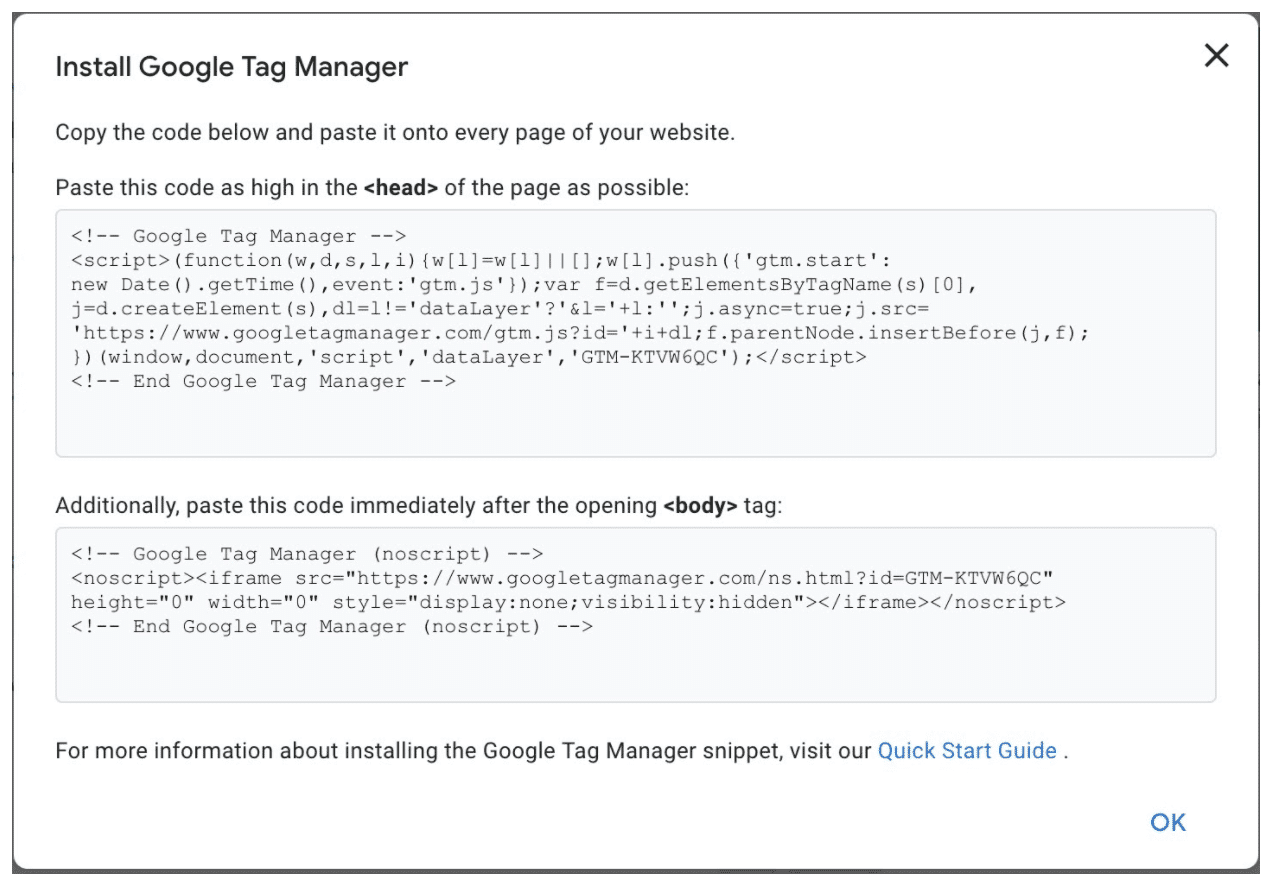
You’ll need to add this code to your website’s back end. How you do that will vary based on your site’s platform. For example, WordPress users can manually add the code or use a dedicated plugin.
When all that is done, you can start using GA4 to track things like:
- Behavior flow. The path customers take as they navigate through your website. This can identify popular landing pages or blog posts. It also illuminates potential ‘drop-off’ points to address.
- Acquisition. What is bringing users to your site? It’s important to know which channels (PPC, organic search, etc.) drive engagement and traffic.
- Conversion. What channels or touchpoints contribute most to your company objectives? This helps you track campaigns and keep a close eye on ROI. Plus, you can allocate resources to different marketing channels based on their impact on conversion rates.
How To Track the Customer Journey (5 Key Stages)
With the preliminaries out of the way, let’s dive into the deep end! It’s time to explore how to track the customer journey at each of the stages laid out during the mapping process.
This is where you’ll look at the path(s) your customers follow when they make purchasing decisions, and interpret the results. Note that while we’ll keep using Google Analytics in our examples, this process works much the same no matter what tools you opt for.
To keep your tracking organized, it’s helpful to walk through it step-by-step in accordance with each stage. We’ll stick with the basic five stages, but you can (and should!) expand and iterate on those in light of your specific customer journey maps.
1. Awareness
In this stage, potential customers first become aware of your business. That’s not where they actually start, however.
Customers begin with a need or desire. Perhaps they want a better shipping solution for their business. Once they’ve identified that need, they start searching for options. That’s when you want them to find you.
What To Track
Essential KPIs to track during this stage include:
- Impressions – Keeping tabs on how many people view important content like ads or blog posts
- SEO rankings – Measuring visibility by paying attention to where important pages appear in search results for relevant keywords
- Click-through rates – Tracking how many people click on important links, which signals the effectiveness of specific marketing or communication channels
Where To Find the Data
You can measure impressions and SEO rankings directly via the Google Analytics Search Console:
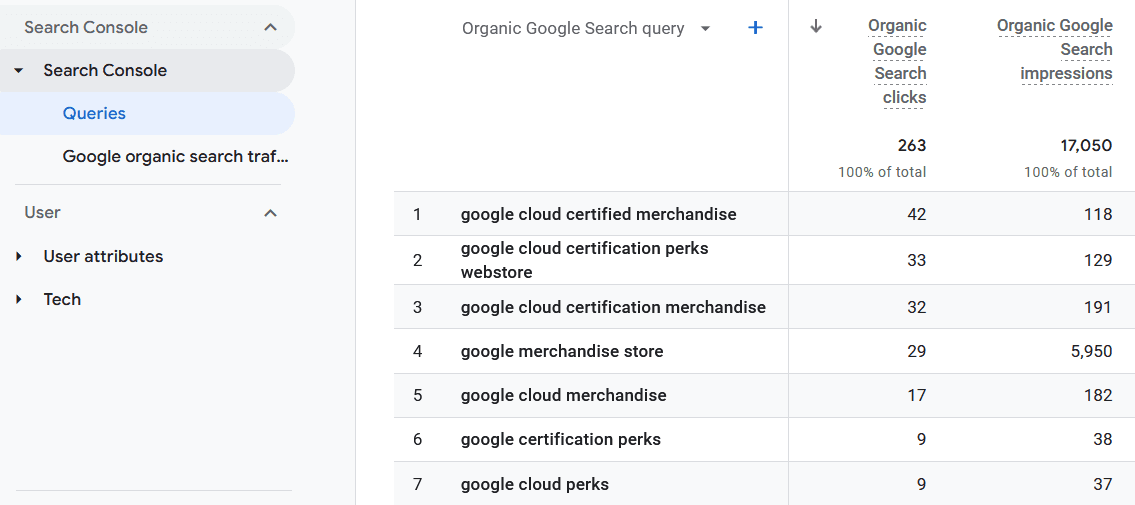
To calculate click-through rate, you’ll divide the number of clicks by the number of impressions, and multiply by 100 (resulting in a percentage). You can do this for all kinds of marketing-related URLs, such as calls to action in paid ads or email marketing campaigns.
How To Assess and Improve Awareness
Like most customer journey-related metrics, there’s no one benchmark for what number of impressions or click-through rate is ‘good’ or ‘poor’. You’ll need to assess the results in context with your niche and industry, as well as your goals.
It’s also important to look at trends over time. Are these numbers growing, even if just a little at a time? Or have they become stagnant (or worse, are they showing a downward trend)?
As for SEO rankings, that’s more straightforward. If you’re not at least in the top ten results, you probably won’t get many clicks. The top three results perform best, while anything that’s not on the first page is practically invisible.
If you’re not happy with the state of your awareness metrics, or simply want to push for improvement, here are a few starting points:
- Create high-quality, actionable content for your target audience. This means developing marketing campaigns and other materials that speak directly to their needs, wants, and characteristics.
- Spend time on SEO keyword research, and learn how to incorporate those keywords effectively into your content.
- Improve click-through rates by implementing strong calls to action and communicating scarcity or urgency (i.e., limited-time promotions).
- Invest time in social media promotion. Social platforms are an excellent, low-cost way to attract attention, especially when used in a highly-targeted way.
- Run paid advertising campaigns, such as Pay-Per-Click (PPC) ads. Like social media, these work best when carefully targeted, and they don’t have to be that expensive.
2. Consideration
In the consideration stage, customers are now aware of the possible solutions to their needs. That includes your business, and at least some of your competitors.
At this point, they’ll often start doing market research to compare brands or products. Reviews, social media comments, articles, and landing/feature pages can all affect their eventual decisions.
What To Track
- Bounce rate – How many people visit your website (or another key platform) and immediately leave, indicating a lack of interest
- Time on page/site – For the people who don’t bounce away, how long they spend exploring your content (and considering your product/service)
- Engagement rate – Whether people are engaging with your content via comments, likes, shares, etc.
Where To Find the Data
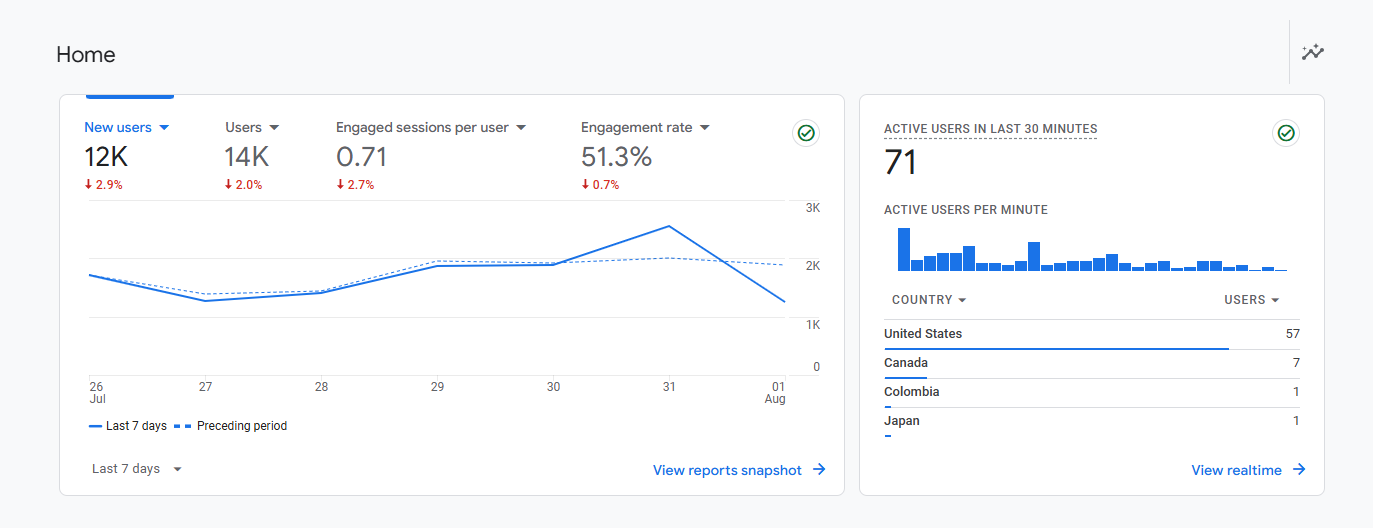
You can view your website’s bounce rate in GA4, along with many types of engagement metrics:
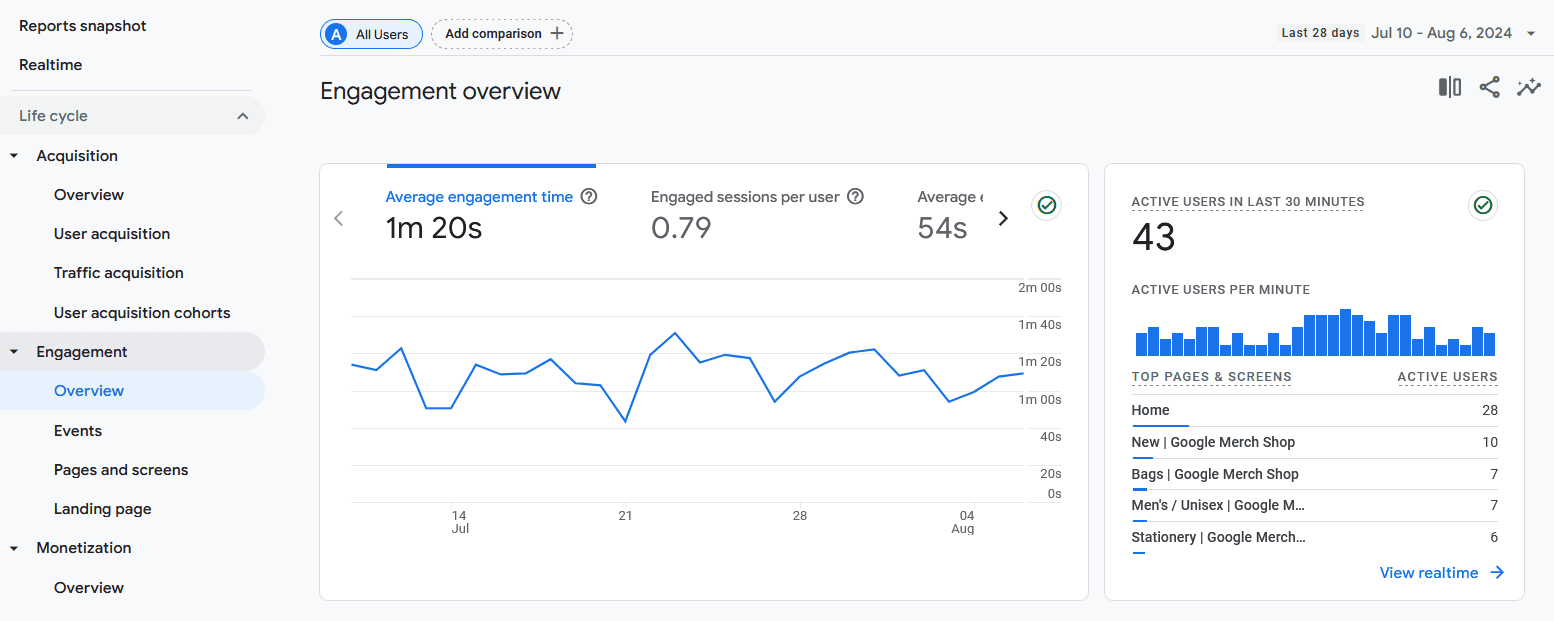
If the metric you want to see doesn’t appear, you can probably add it by customizing your reports.
Time on page/site can be a little tricky, because there are a number of ways to evaluate it. GA4 uses ‘average engagement time’, which aims to measure how long users spend actually interacting with your website (as opposed to simply having it open).
How To Assess and Improve Consideration
The consideration stage is the least visible. You can’t be sure exactly how long a customer spends learning about your business, especially since some of that education might occur elsewhere (for instance, on third-party review sites). And of course, you don’t know what they’re learning about your competitors.
The best you can do is watch for and encourage active engagement. Potential customers who interact with your business by reading articles, clicking on links, and signing up for your email list are a lot more likely to make purchases.
If your engagement metrics are lacking, you can try:
- Carrying out a full audit of your website, and optimizing it where possible for performance, ease of use, and accessibility
- Reviewing what content does and doesn’t provoke engagement, so you can create more of the former
- Conducting A/B testing to experiment with new approaches
- Offering plenty of educational resources for learning about your products/services (this encompasses everything from feature pages to knowledge base articles)
- Giving people a reason to engage, such as by offering small rewards in exchange for email list or free trial sign-ups
3. Decision/Purchase
This stage is the shortest, but the most important. Now the customer has all the information they need to make a decision. Will they spend money on your product or service?
Whether they take the plunge depends partly on the success of the previous stages. But how easy it is to make a purchase also matters. Streamlining the process removes potential barriers to conversion. At a minimum, this means offering seamless checkout, clear pricing, and smooth onboarding.
What To Track
- Conversion rate – How many leads make a purchase, or otherwise perform the desired action
- Trial-to-paid conversion – An example of tracking the conversion rates for specific channels/maps, such as the amount of people who sign up for a free trial and later make a purchase
- Customer growth – A more big-picture metric that tells you how many customers you’re gaining over set periods of time (useful for tracking overall growth)
Where To Find the Data
Any quality tracking software should make it easy to track all kinds of conversion rates:
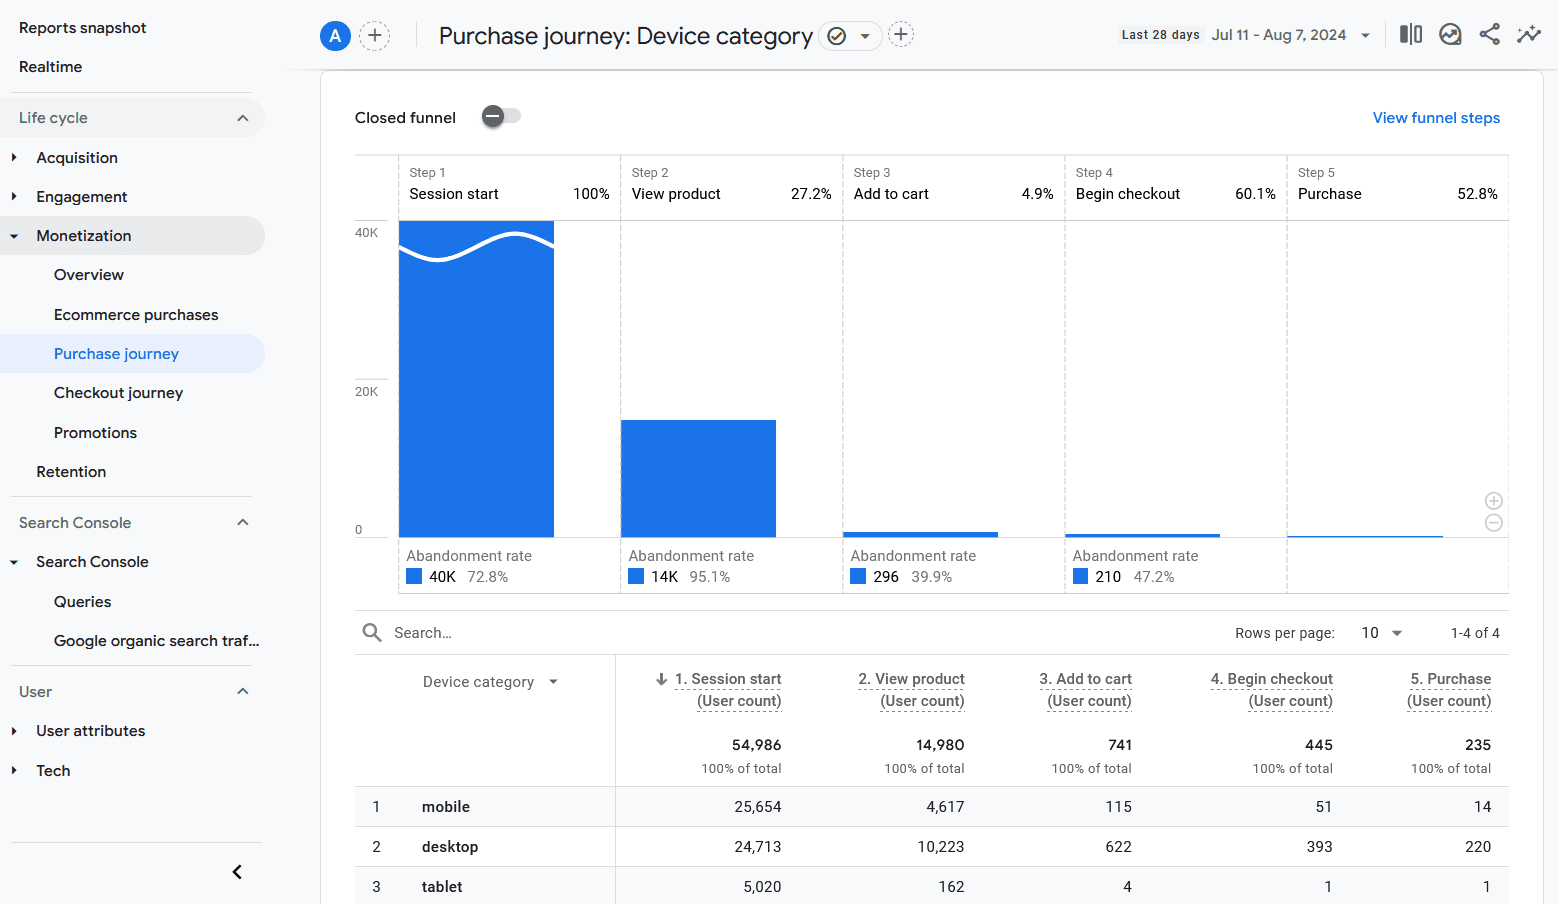
Just keep in mind that you’ll need to set up the proper tracking. How you do that will depend on what you’re trying to analyze. In GA4 you can create ‘events’ that are customized to match whatever action and conditions matter to your business.
Customer growth requires a simple calculation:
(Customers this period – customers last period) / customers last period x 100
This results in a percentage, and “period” can be whatever length of time you care about (such as a month or a quarter).
How To Assess and Improve Decision
Sub-par conversion rates are probably the hardest metric to assess. Just about anything can stop a person from making a purchase.
The first thing to do is take a look back at the previous stages of your customer map. Many issues during the awareness and consideration phases can cause poor customer growth.
If the problem seems to lie with the decision stage specifically, something is making potential customers change their minds at the last minute. They were primed to buy your product or service – so what went wrong?
You might want to consider:
- Identifying and fixing potential points of friction – anything that makes it hard to convert (a slow website, poor accessibility, a long and/or confusing checkout process, only one payment option, etc.)
- Carrying out more A/B testing, in particular with varying calls to action and checkout processes
- Evaluating your pricing and payment options, to ensure that you’re offering enough choices and at the right price points for your ideal customer
- Auditing your website, pricing page, and checkout process for clarity and transparency – are the differences between plans clear, are all costs stated upfront, and is it easy for a customer to determine which plan/product they need to get the features they want?
4. Retention/Loyalty
At this point, the post-sale customer journey begins. While many companies focus on acquisition, retention is a better way to drive profits, improve stability, and increase ROI.
A healthy Lifetime Value to Customer Acquisition Cost (LTV to CAC) ratio indicates greater profitability over the long-term. So at this stage, you’ll need to do everything in your power to leave the customer with a positive impression. This can be done with strategies like loyalty rewards, personalization, and world-class customer support.
What To Track
- Retention Rate – The number of buyers who come back to make further purchases
- Churn Rate – The number of customers who leave over a set period of time
- LTV (Lifetime Value) – How much profit you make from a customer over the entire lifetime of their relationship with your company (not just that initial sale)
- CSAT (Customer Satisfaction) ratings – Along with other customer service KPIs, this helps you assess how happy customers are with both your offerings and your support
Where To Find the Data
Retention rate isn’t typically found by tracking specific customers to see if they stick around. Instead, it’s measured in the same way as customer growth (discussed in the previous section). The difference is that this time, you’re making sure the number of customers from one period to the next is at least remaining stable.
To calculate churn rate, you can compare the amount of ‘lost’ customers to the total number of customers during a set period. Be sure to define what ‘lost’ means for your business, whether that’s cancellations, failures to renew a service for another year, etc.
To calculate LTV, you’ll multiply customer value (how much revenue you earn from the average customer in a set period) by customer lifetime (how long the average customer sticks around).
The underlying metrics for these calculations can be more difficult to track, especially since the data you’ll need depends on your niche and customer base. GA4 can help with some of the necessary information. For other metrics, you may need to implement some manual tracking or employ more advanced tools.
As for customer satisfaction ratings, you can gather those easily using our support helpdesk, Groove:
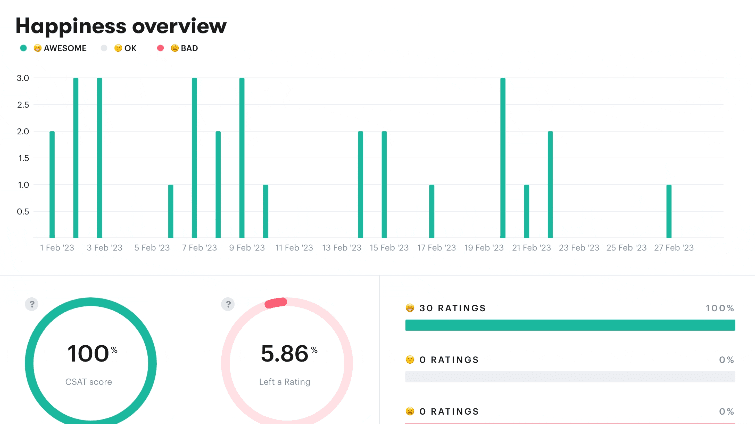
In fact, you can use Groove to track all kinds of customer experience-related metrics, so you know how happy customers are, whether your support is meeting their needs, what they’d like to see changed, and more.
How To Assess and Improve Retention
If you’re bringing on plenty of new customers but struggling to keep them, you’re not alone. You’re also not alone in worrying about it. After all, it’s much more cost-effective to retain a customer than to attract a new one.
Here are a few of the things you can try to address this problem:
- Study the demographics of buyers who leave, are dissatisfied, or are merely unengaged, and look for trends. There may be segments of your customer base with specific needs that you aren’t serving effectively.
- Provide a clear onboarding process, easy-to-access support, and lots of self-serve resources. Customers are more likely to stick around if it’s easy to get help and find answers.
- Talk to your customers – check in regularly and ask them about their experiences.
- Train your team on how to communicate effectively and provide top-quality service.
- Act on the feedback you receive from customers, and continually improve your offerings and support.
5. Advocacy/Referral
If you succeed in the retention stage, you’ll have customers who are loyal to your business. Obviously, that’s great for your bottom line. But it also helps with bringing in even more customers and easing their own journeys.
Not every loyal buyer will become an advocate, but some will! Happy customers are powerful success stories for your brand. You can share their experiences via case studies and testimonials, and they can work on your behalf via word-of-mouth, social media shares, and referrals.
What To Track
- Net Promoter Score (NPS) – A measurement of loyalty that represents how many customers would be willing to recommend your business to others
- Reviews and social media shares – How much positive conversation is being generated about your business by existing customers
- Referrals – The number of new leads/buyers who were referred to your business by other customers
Where To Find the Data
These aren’t metrics you’ll generally be able to track in an analytics platform. Instead, you’ll need to go directly to the source.
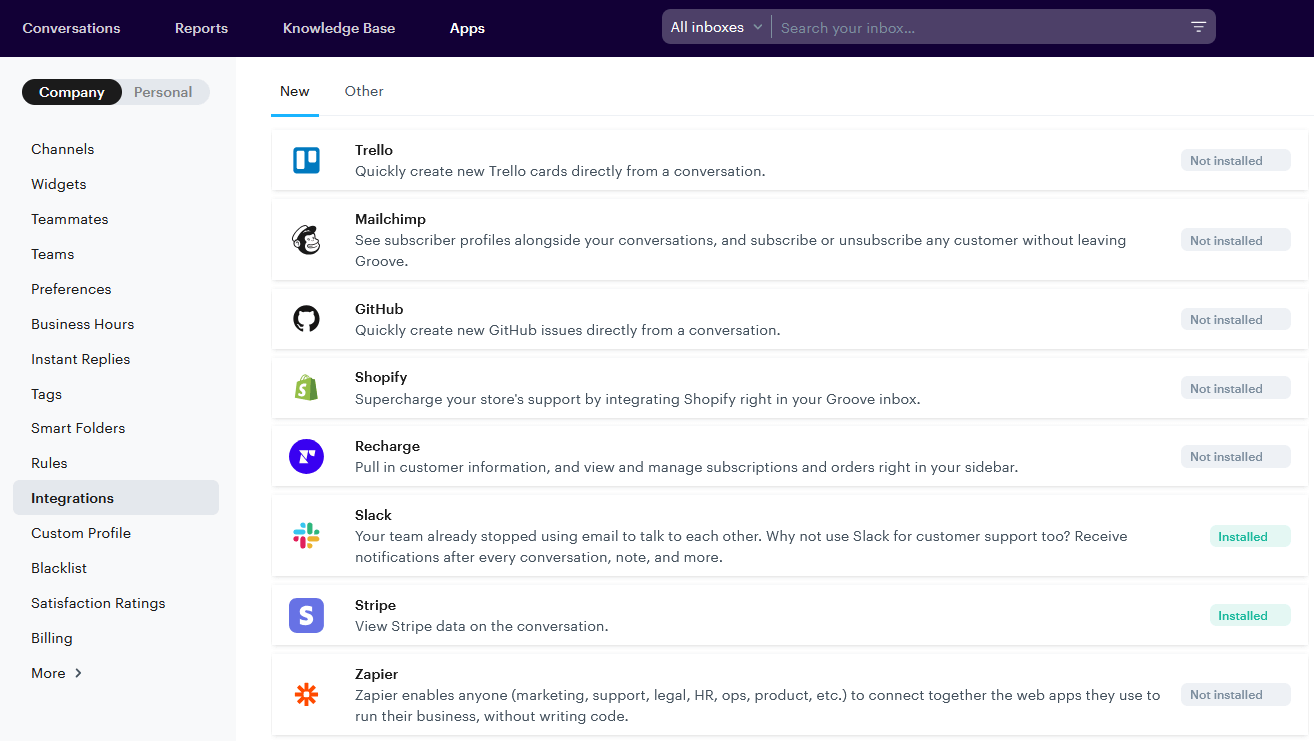
That means keeping tabs on the number of positive reviews you receive, as well as engagement (shares, likes, comments) on the social media platforms you care about. Groove makes this process easier by letting you integrate key platforms with your customer support helpdesk:
You can use customer surveys to measure NPS. This is also a good time to ask your customer base other important questions about their experiences. Just don’t overwhelm them (few people like filling out ten-page surveys).
As for referrals, you can ask new customers what brought them your way! Again, this is something made simple with Groove. You can create a ‘where did you hear about us’ template and send it out to each new buyer.
How To Assess and Improve Advocacy
Don’t be disheartened if you see very little advocacy, especially when your company is still young. Most customers are passive, and it takes a lot to get them to ‘sell’ your business for you.
The good news is just about anything that improves your products, services, and support can improve advocacy as well. If this is a specific area of focus, some of the more effective options are:
- Actively encourage customers to leave reviews and feedback (and even reward them for doing so).
- Respond to reviews, whether positive or negative, to improve trust and encourage more engagement.
- Create regular announcements and content about new developments/features, to get people excited about what’s happening and help them feel ‘in the know’.
- Build relationships with your customers, and create a sense of community (such as via email newsletters or forums).
- Create a referral program that explicitly rewards customers for sharing your business with their friends and networks.
Grow Your Business, One Successful Customer Journey at a Time
We’ve covered a lot in this post, and it’s still only a starting point. There are plenty of other metrics you might consider tracking, tools you can use, and touchpoints to be evaluated and improved.
That’s okay – learning how to track the customer journey and optimize it is an ongoing process. You’ll never perfect it, but if you make incremental improvements over time, they’ll add up and start making a real difference.
If you’re not quite sure where to begin, you can start by providing top-quality customer service with Groove! How well you communicate with and support customers impacts every stage of their journeys with your business.
Groove supports your small business with a platform that simplifies and streamlines customer interactions. Plus, it helps you track key metrics that let you know how buyers are feeling and what you can do to make them happier. Check out our free trial and see for yourself!
How To Conduct a Voice of the Customer Analysis
Running a small business is tough. You’re juggling a million things, from marketing, sales and product development to customer service. I bet sometimes it feels like there aren’t enough hours in the day. But amidst all the chaos, there’s one crucial element that often gets overlooked: Truly understanding your customers. That’s where Voice of the […]
5 Common SaaS Pain Points (And What To Do About Them)
So the other day, X (formerly known as Twitter) and YouTube were flooded with discussions about tech reviewer MKBHD’s new project – a wallpaper app called Panels. This product has been in the pipelines for a while. And I thought to myself: “Well, this is going to be an instant success.” Because MKBHD (Marques Brownlee) […]
